Fig. 11
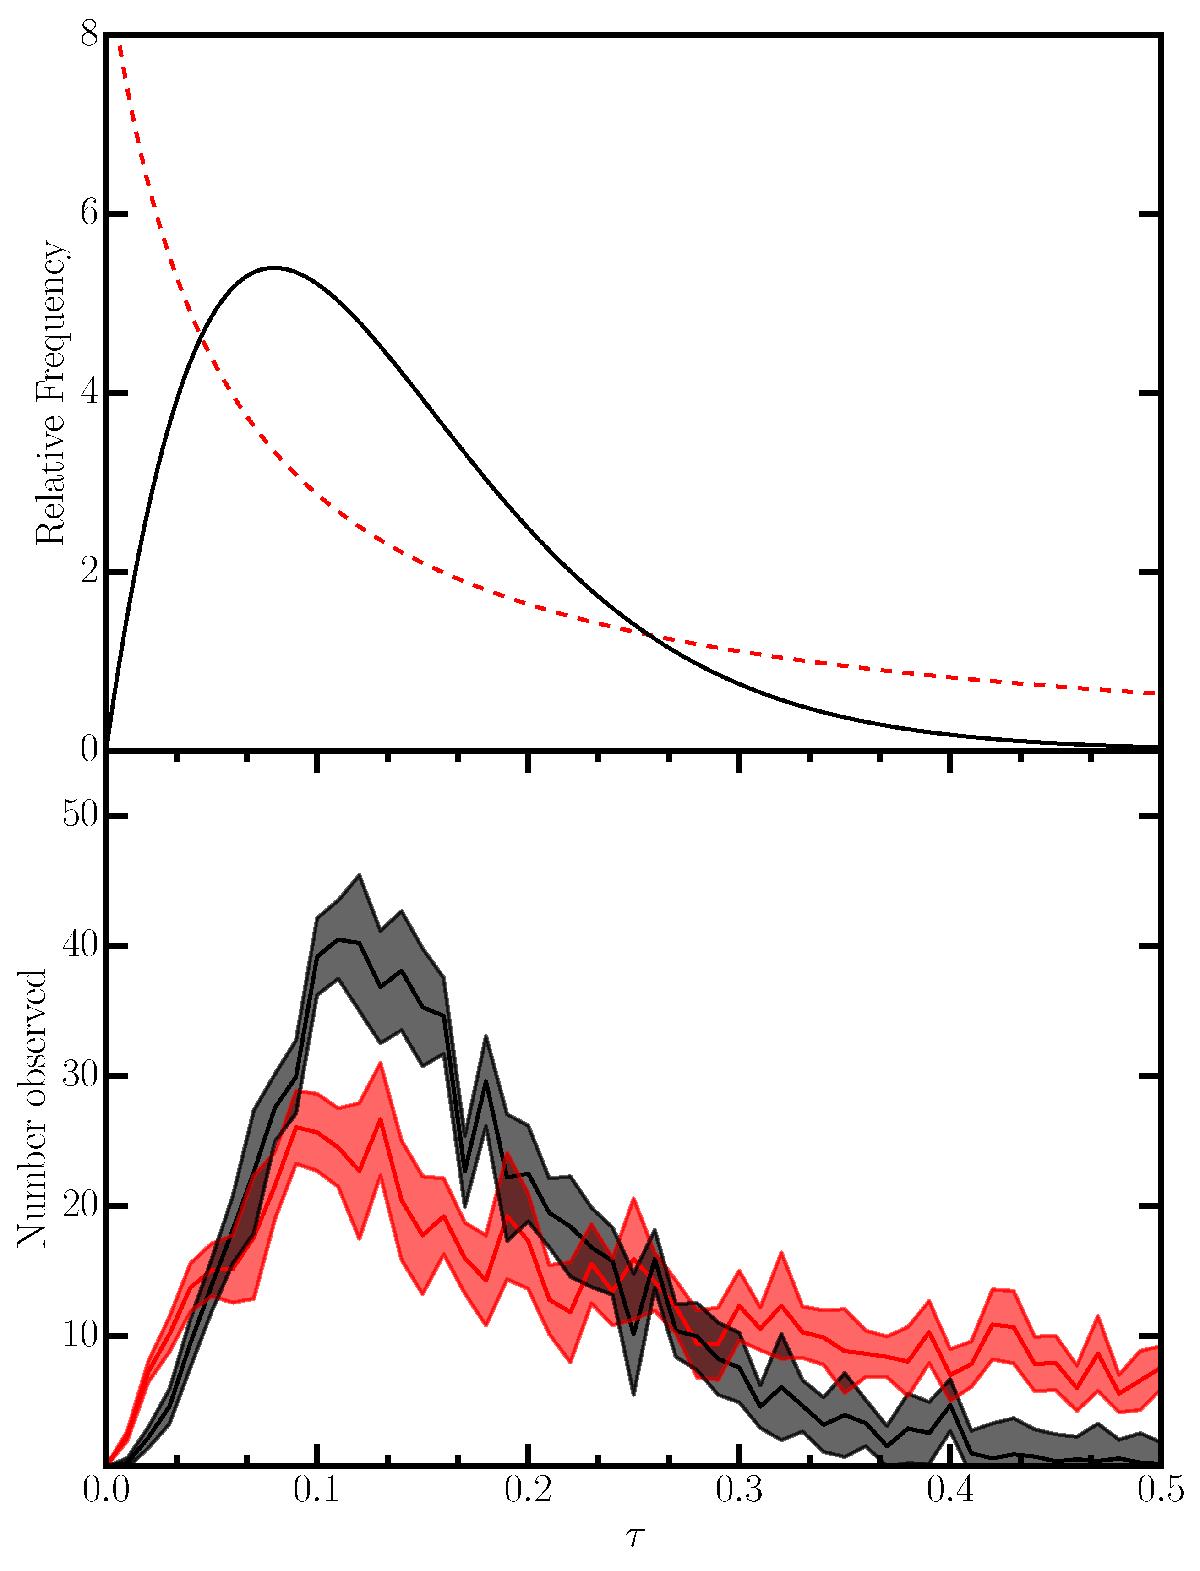
Top panel: two suggested intrinsic distributions for the frequency of associated absorbers of a given optical depth. The primary difference is at very low optical depth values, where the exponential-shaped distribution is dominated by low values, whereas the other peaks at τ ~ 0.08. Bottom panel: resulting observed optical depth distributions for the SHARP survey, assuming absorbers are drawn from the two distributions in the top panel. The solid lines indicate the average observed distributions, while the shaded regions their dispersion.
Current usage metrics show cumulative count of Article Views (full-text article views including HTML views, PDF and ePub downloads, according to the available data) and Abstracts Views on Vision4Press platform.
Data correspond to usage on the plateform after 2015. The current usage metrics is available 48-96 hours after online publication and is updated daily on week days.
Initial download of the metrics may take a while.