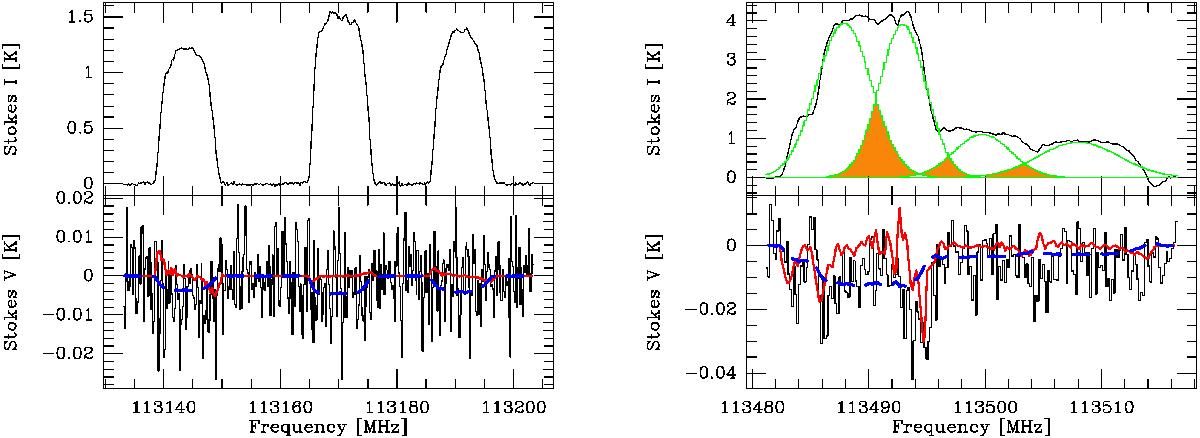
Fig. 1
IRC+10216: observations of November 2006 for the position (− 10″, + 20″). Top left: CN (1, 1/2) → (0, 1/2) Stokes I spectrum. Bottom left: V spectrum (in black) and least-squares fit (in red) using the Crutcher et al. (1996) method described in the text. The dashed blue line shows our fit assuming C3 = 0. Right: same for the CN transition (1, 3/2) → (0, 1/2), with, in addition, the Gaussian fit for each individual line overplotted in green and the line overlap area coloured in orange on the I spectrum.
Current usage metrics show cumulative count of Article Views (full-text article views including HTML views, PDF and ePub downloads, according to the available data) and Abstracts Views on Vision4Press platform.
Data correspond to usage on the plateform after 2015. The current usage metrics is available 48-96 hours after online publication and is updated daily on week days.
Initial download of the metrics may take a while.