Free Access
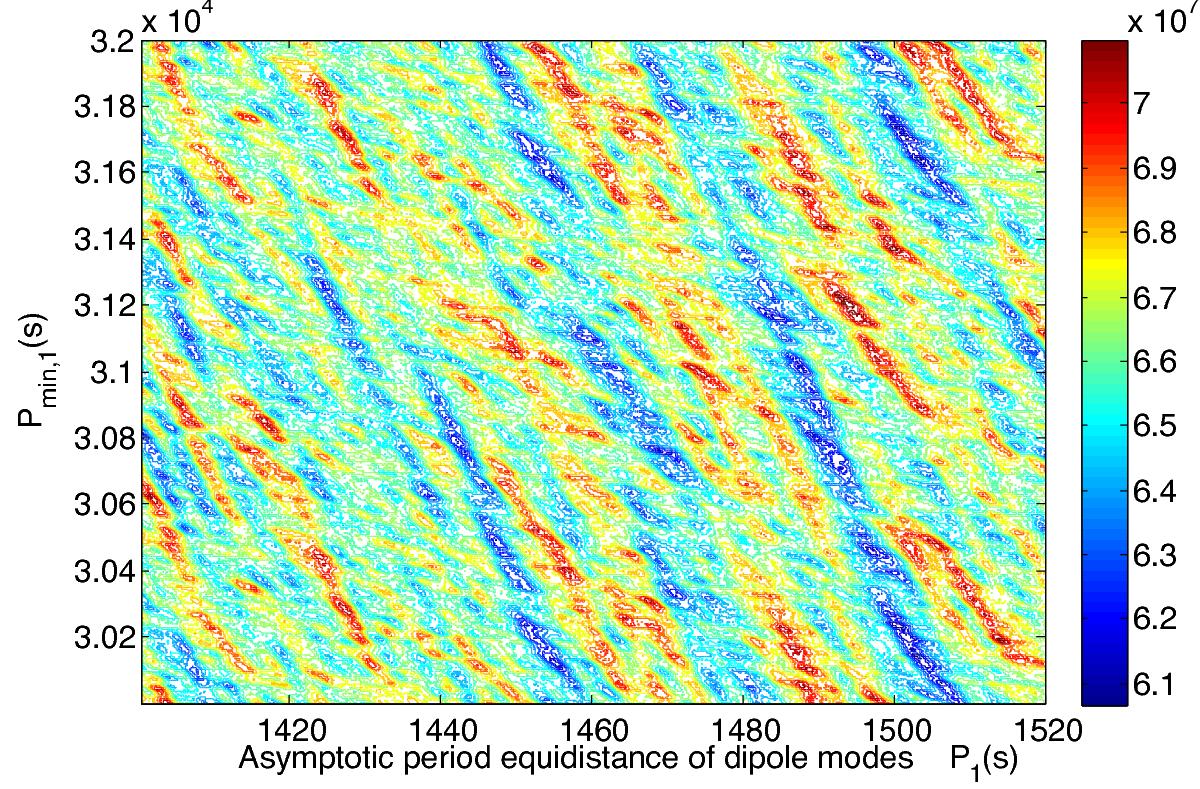
Fig. 22

As in Fig. 20, the sum of the 228 values of a model based on 76 g-mode dipole triplets and applied on an artificial data set, with an assumed splitting value of 267 nHz that corresponds to the highest correlation peak in Fig. 14. No significant equidistant period is shown, as demonstrated quantitatively by the next figure.
Current usage metrics show cumulative count of Article Views (full-text article views including HTML views, PDF and ePub downloads, according to the available data) and Abstracts Views on Vision4Press platform.
Data correspond to usage on the plateform after 2015. The current usage metrics is available 48-96 hours after online publication and is updated daily on week days.
Initial download of the metrics may take a while.


