Fig. 6
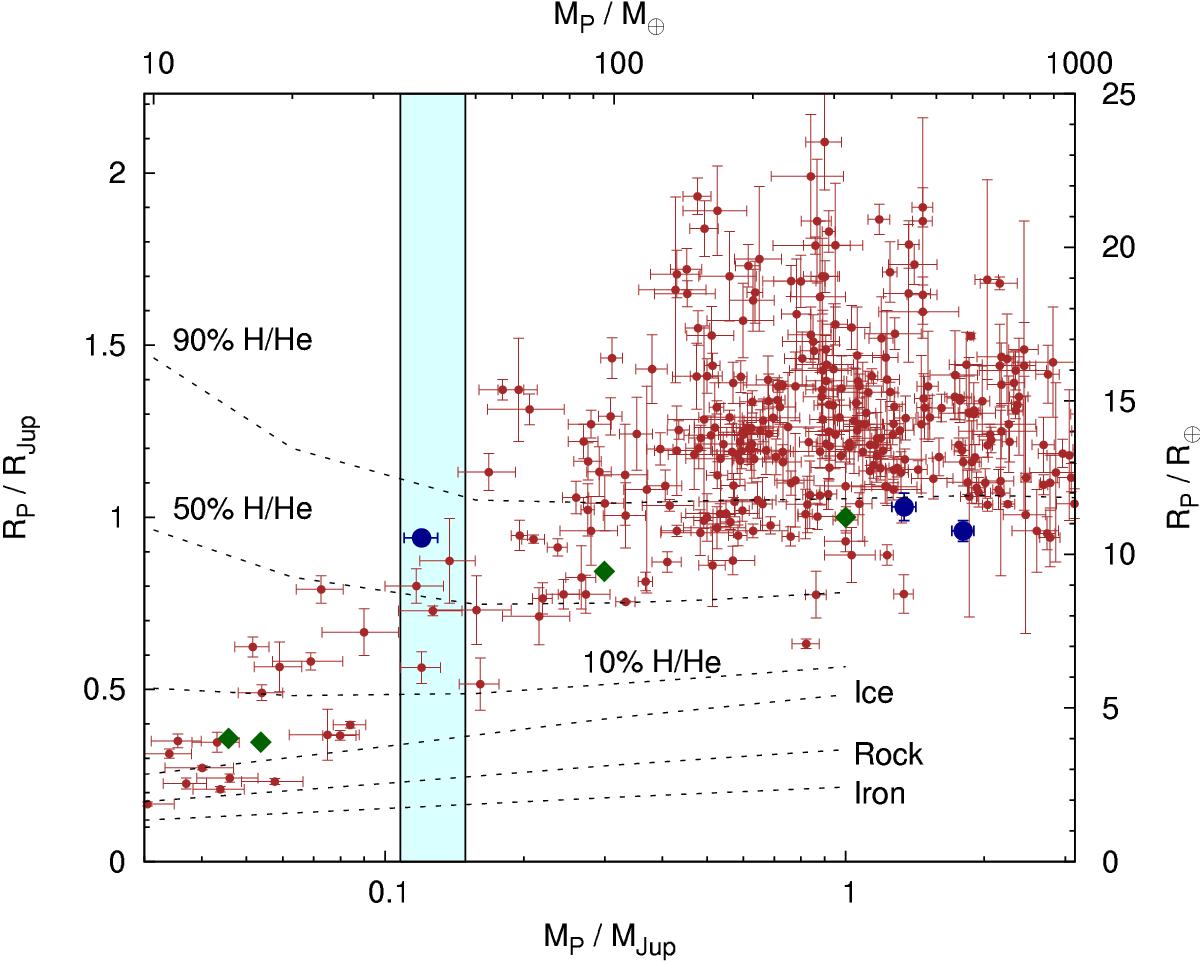
Planetary mass-radius diagram showing the planets presented herein (blue circles), the Solar System giants (green diamonds) and the transiting exoplanets (red circles; data from TEPCat; masses measured by the radial-velocity technique to better than 20% precision). The dotted lines depict model planets of pure iron, rock and ice (from Fortney et al. 2007) and 3-Gyr isochrones for model planets with various H/He fractions that are irradiated by a Sun-like star at 0.045 AU (from Baraffe et al. 2008). The cyan rectangle indicates the notional transition region between ice giants and gas giants, where planetary mass is between twice that of Neptune and half that of Saturn.
Current usage metrics show cumulative count of Article Views (full-text article views including HTML views, PDF and ePub downloads, according to the available data) and Abstracts Views on Vision4Press platform.
Data correspond to usage on the plateform after 2015. The current usage metrics is available 48-96 hours after online publication and is updated daily on week days.
Initial download of the metrics may take a while.