Fig. 5
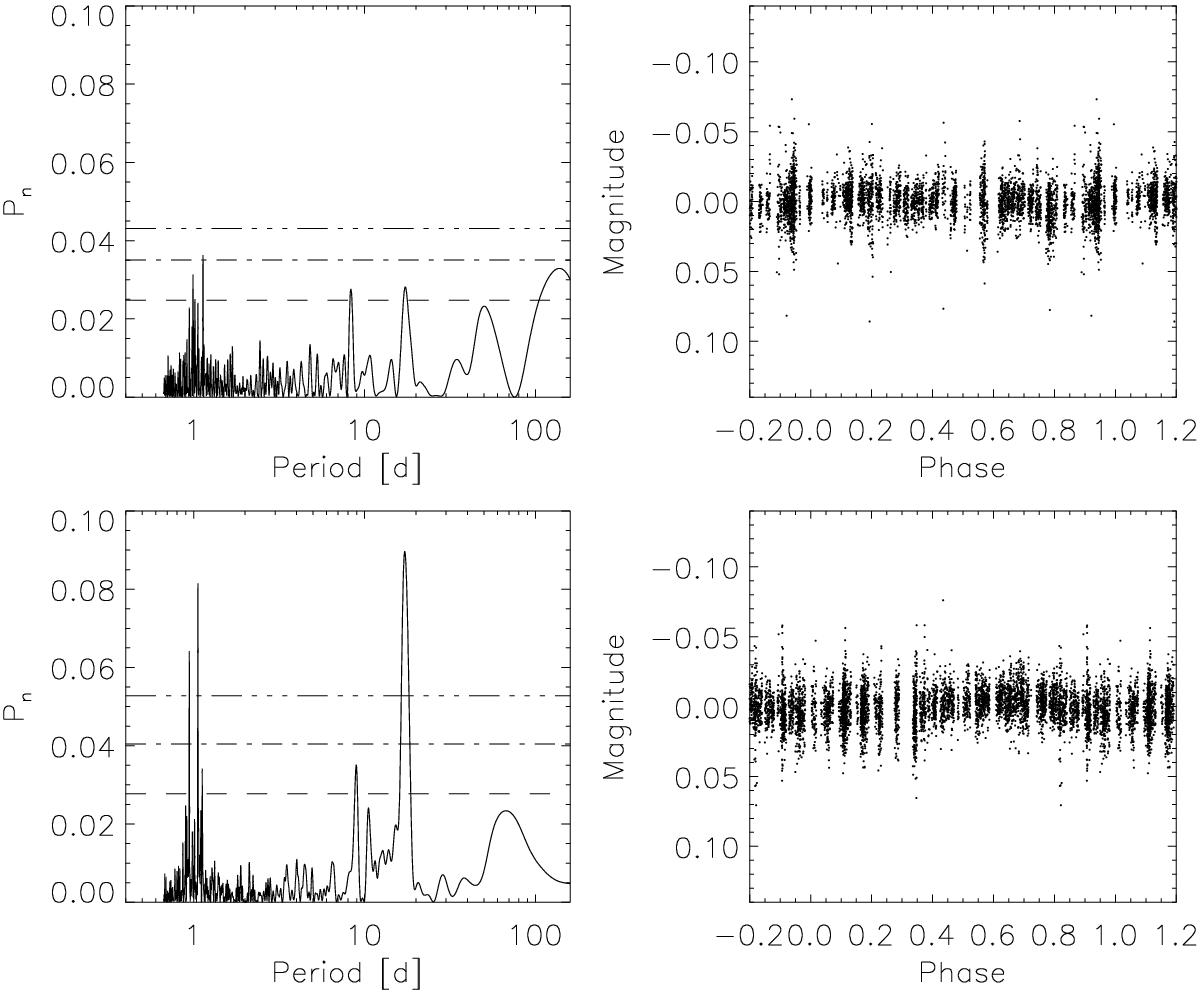
Left: periodograms of the WASP lightcurves for WASP-107 obtained during 2009 (upper panel) and 2010 (lower panel). Horizontal lines indicate false-alarm probability levels 0.1, 0.01 and 0.001. Right: lightcurves folded on the assumed rotation period of 17.1 days for data obtained during 2009 (upper panel) and 2010 (lower panel).
Current usage metrics show cumulative count of Article Views (full-text article views including HTML views, PDF and ePub downloads, according to the available data) and Abstracts Views on Vision4Press platform.
Data correspond to usage on the plateform after 2015. The current usage metrics is available 48-96 hours after online publication and is updated daily on week days.
Initial download of the metrics may take a while.