Fig. 5
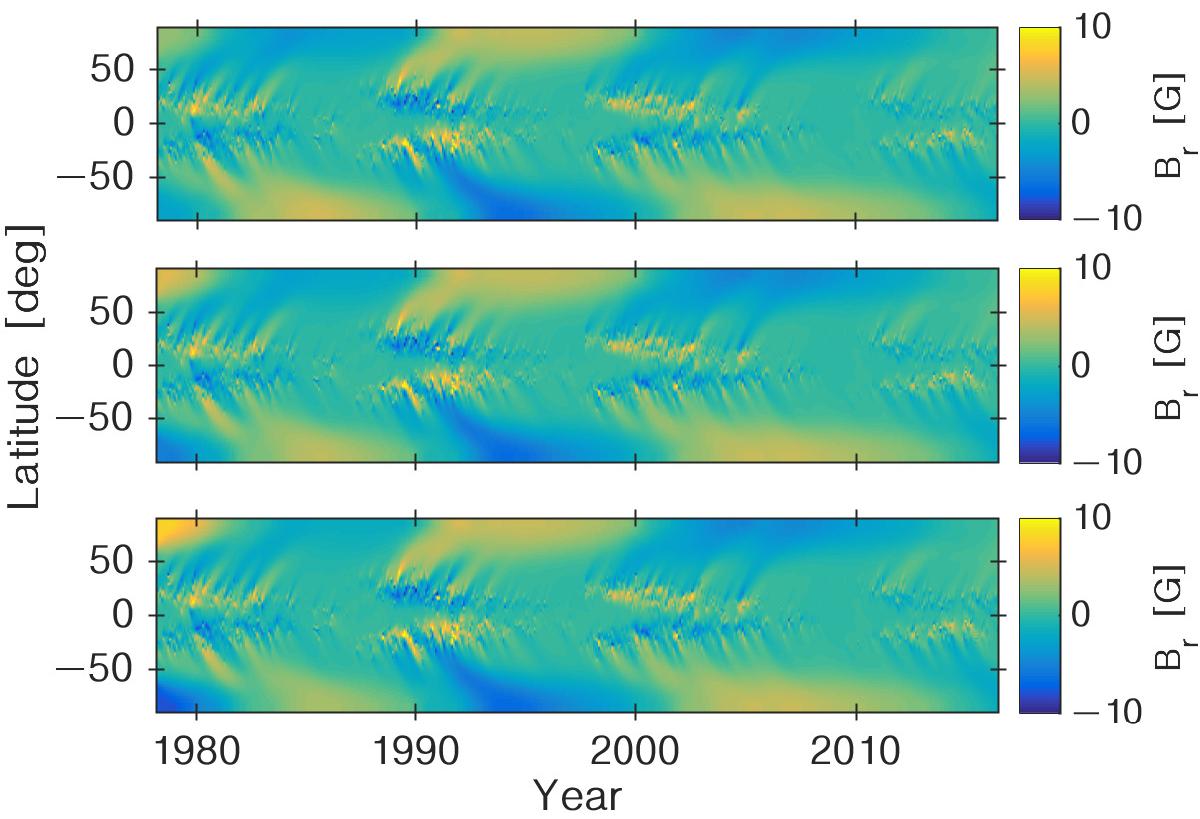
Super-synoptic maps of three different SFT simulations that use artificial synoptic maps for the first rotation. The simulations start from January 1978 (CR 1664). Top panel: field strength is ±2.5 G above and below ±60° latitude and zero elsewhere. Middle panel: ±5.0 G above and below ±60°, zero elsewhere. Bottom panel: ±7.5 G above and below ±60°, zero elsewhere. Yellow and blue tones correspond to positive and negative polarity.
Current usage metrics show cumulative count of Article Views (full-text article views including HTML views, PDF and ePub downloads, according to the available data) and Abstracts Views on Vision4Press platform.
Data correspond to usage on the plateform after 2015. The current usage metrics is available 48-96 hours after online publication and is updated daily on week days.
Initial download of the metrics may take a while.