Free Access
Fig. 2
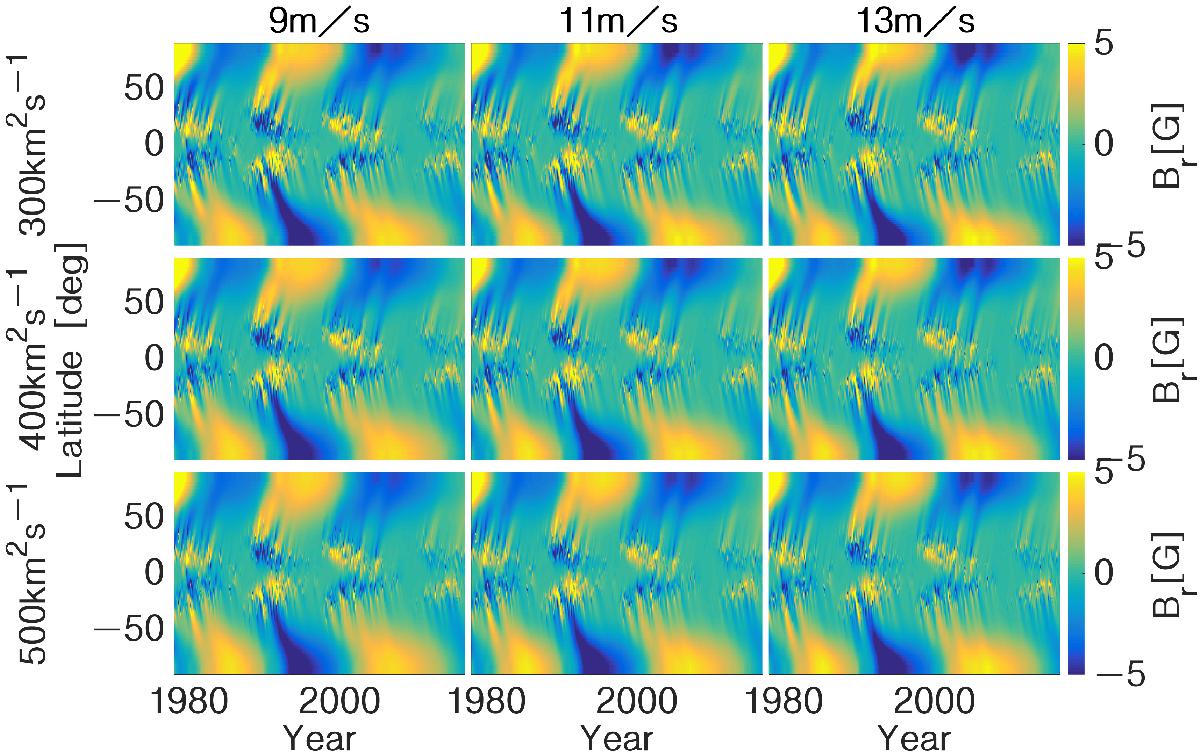
Super-synoptic maps from nine SFT simulations from January 1978 (CR 1664) to May 2016 (CR 2177) using different values of meridional circulation peak velocity u0 and supergranular diffusion coefficient D. Yellow and blue tones correspond to positive and negative polarity.
Current usage metrics show cumulative count of Article Views (full-text article views including HTML views, PDF and ePub downloads, according to the available data) and Abstracts Views on Vision4Press platform.
Data correspond to usage on the plateform after 2015. The current usage metrics is available 48-96 hours after online publication and is updated daily on week days.
Initial download of the metrics may take a while.