Fig. 8
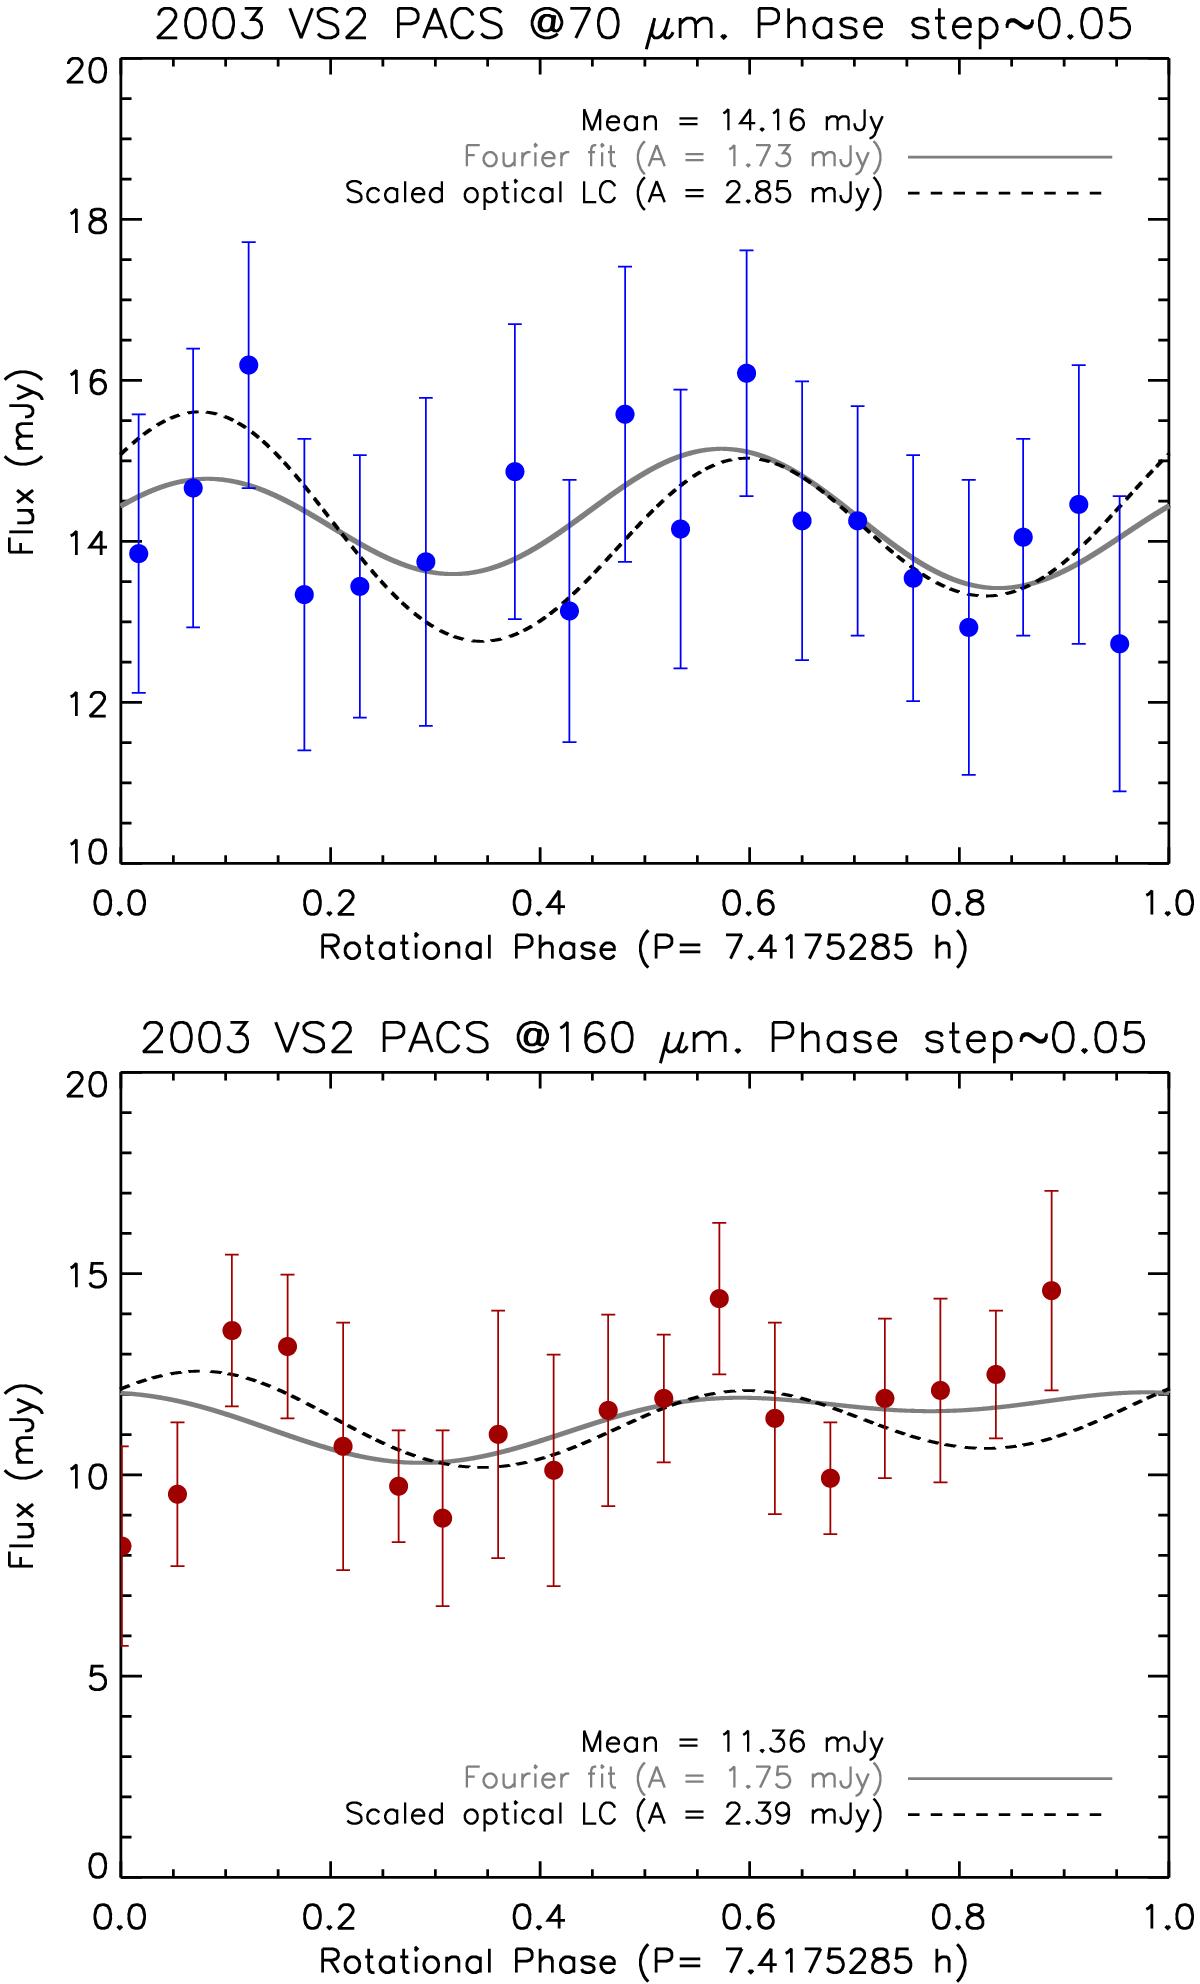
Thermal time series curve at 70 μm (top) and 160 μm (bottom) for 2003 VS2. The black dashed curve is the scaled optical light curve obtained by rescaling the optical brightness to match the mean of the thermal fluxes. The grey solid curve is a Fourier fit to the thermal data. The reference for zero phase is at JD = 2 452 992.768380 days, uncorrected for light-time. Rotational phases have been computed using light-time corrected Julian dates and light-time corrected zero date (see caption of Table A.2 for further details). The uncertainty in the rotational phase is ±0.01.
Current usage metrics show cumulative count of Article Views (full-text article views including HTML views, PDF and ePub downloads, according to the available data) and Abstracts Views on Vision4Press platform.
Data correspond to usage on the plateform after 2015. The current usage metrics is available 48-96 hours after online publication and is updated daily on week days.
Initial download of the metrics may take a while.