Fig. 5
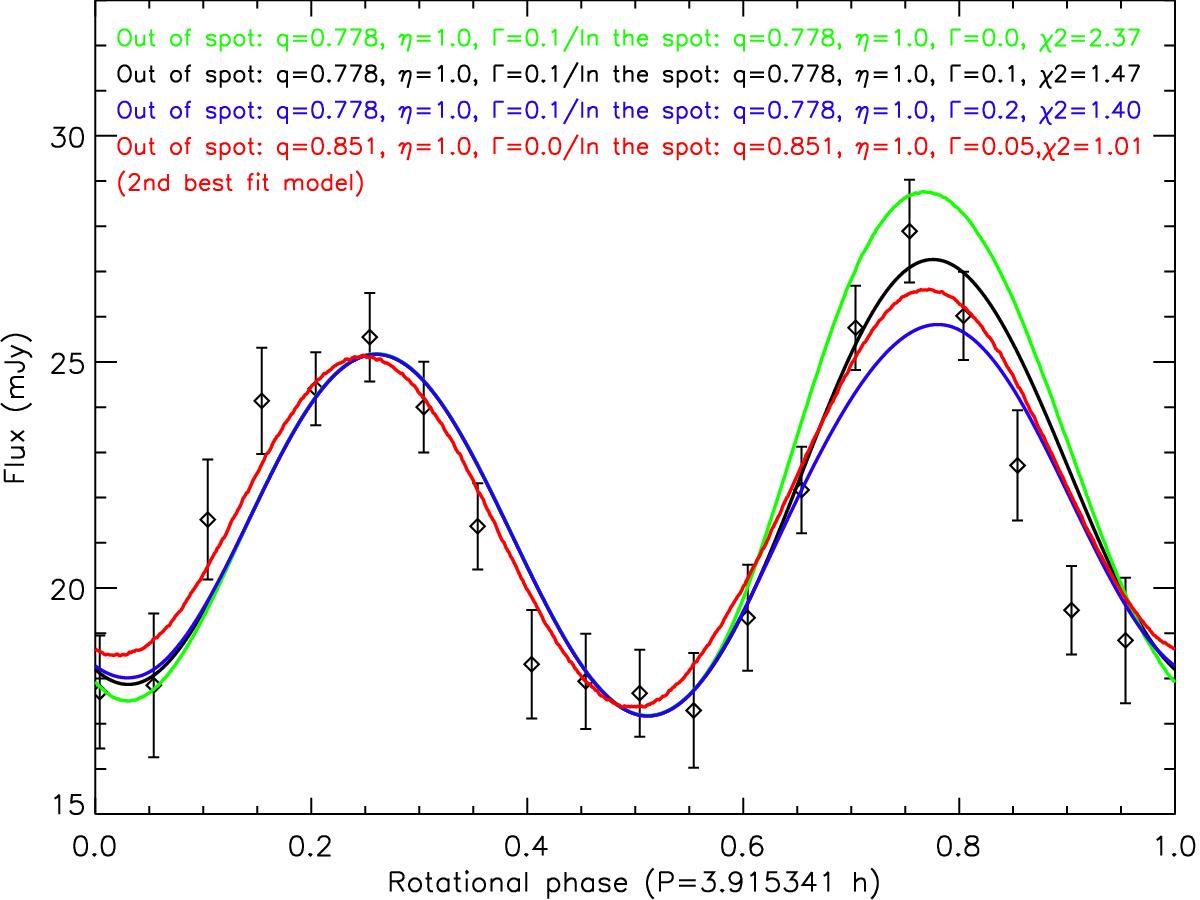
Models with variable thermal inertia in the spot region. In these models, the spot phase integral is kept at the same value as in the no-spot region. The green, black, and blue curves are for Γ = 0.1 MKS and q = 0.778 outside of the spot, and Γ = 0.0, 0.1, and 0.2 MKS in the spot. The red curve represents the second best fit model at 100 μm with Γ = 0.0 MKS and q = 0.851 outside of the spot, and Γspot = 0.05 MKS in the spot.
Current usage metrics show cumulative count of Article Views (full-text article views including HTML views, PDF and ePub downloads, according to the available data) and Abstracts Views on Vision4Press platform.
Data correspond to usage on the plateform after 2015. The current usage metrics is available 48-96 hours after online publication and is updated daily on week days.
Initial download of the metrics may take a while.