Fig. 2
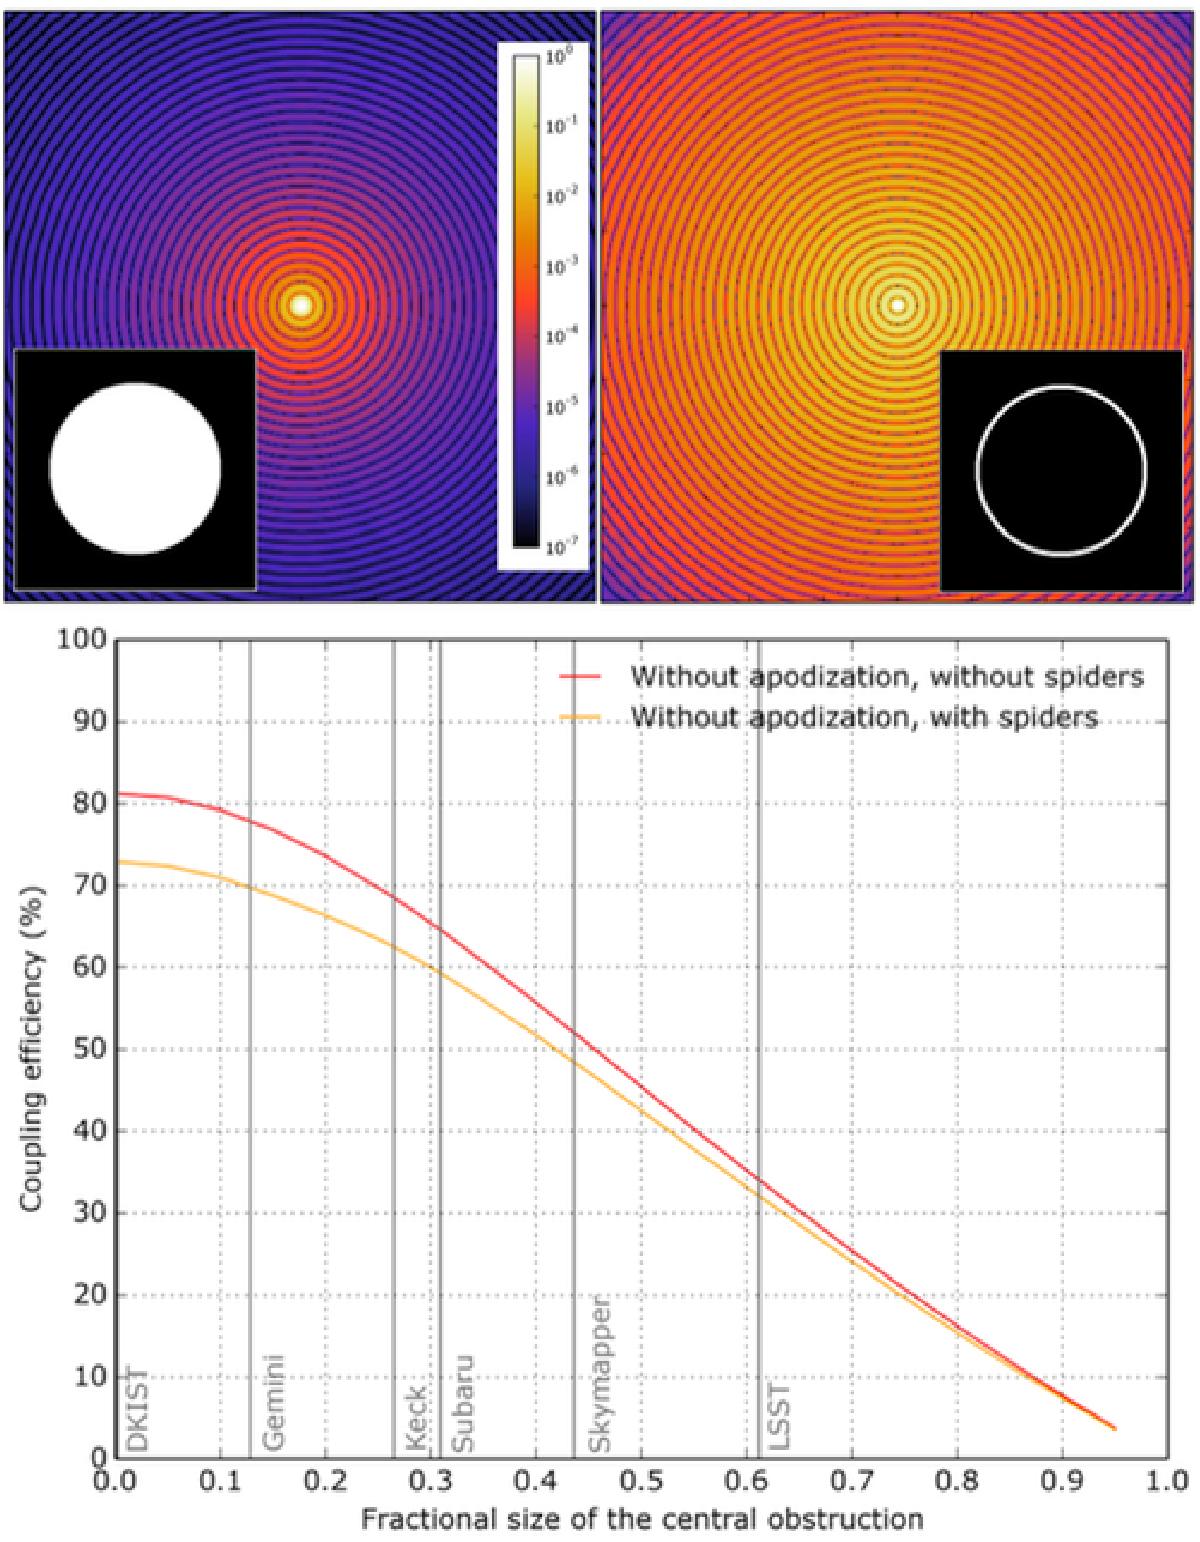
Logarithmic stretch of a simulated PSF with (top left) no central obstruction and (top right) a relatively large central obstruction. Pupil geometries are shown in the insets. Bottom: coupling efficiency to a SMF from the PSF of a telescope as a function of the relative size of the central obstruction. The simulations were made with and without spiders. Grey vertical lines indicate the relative size of the secondary for several major observatories. We note that DKIST has a line at 0.
Current usage metrics show cumulative count of Article Views (full-text article views including HTML views, PDF and ePub downloads, according to the available data) and Abstracts Views on Vision4Press platform.
Data correspond to usage on the plateform after 2015. The current usage metrics is available 48-96 hours after online publication and is updated daily on week days.
Initial download of the metrics may take a while.