Fig. A.3
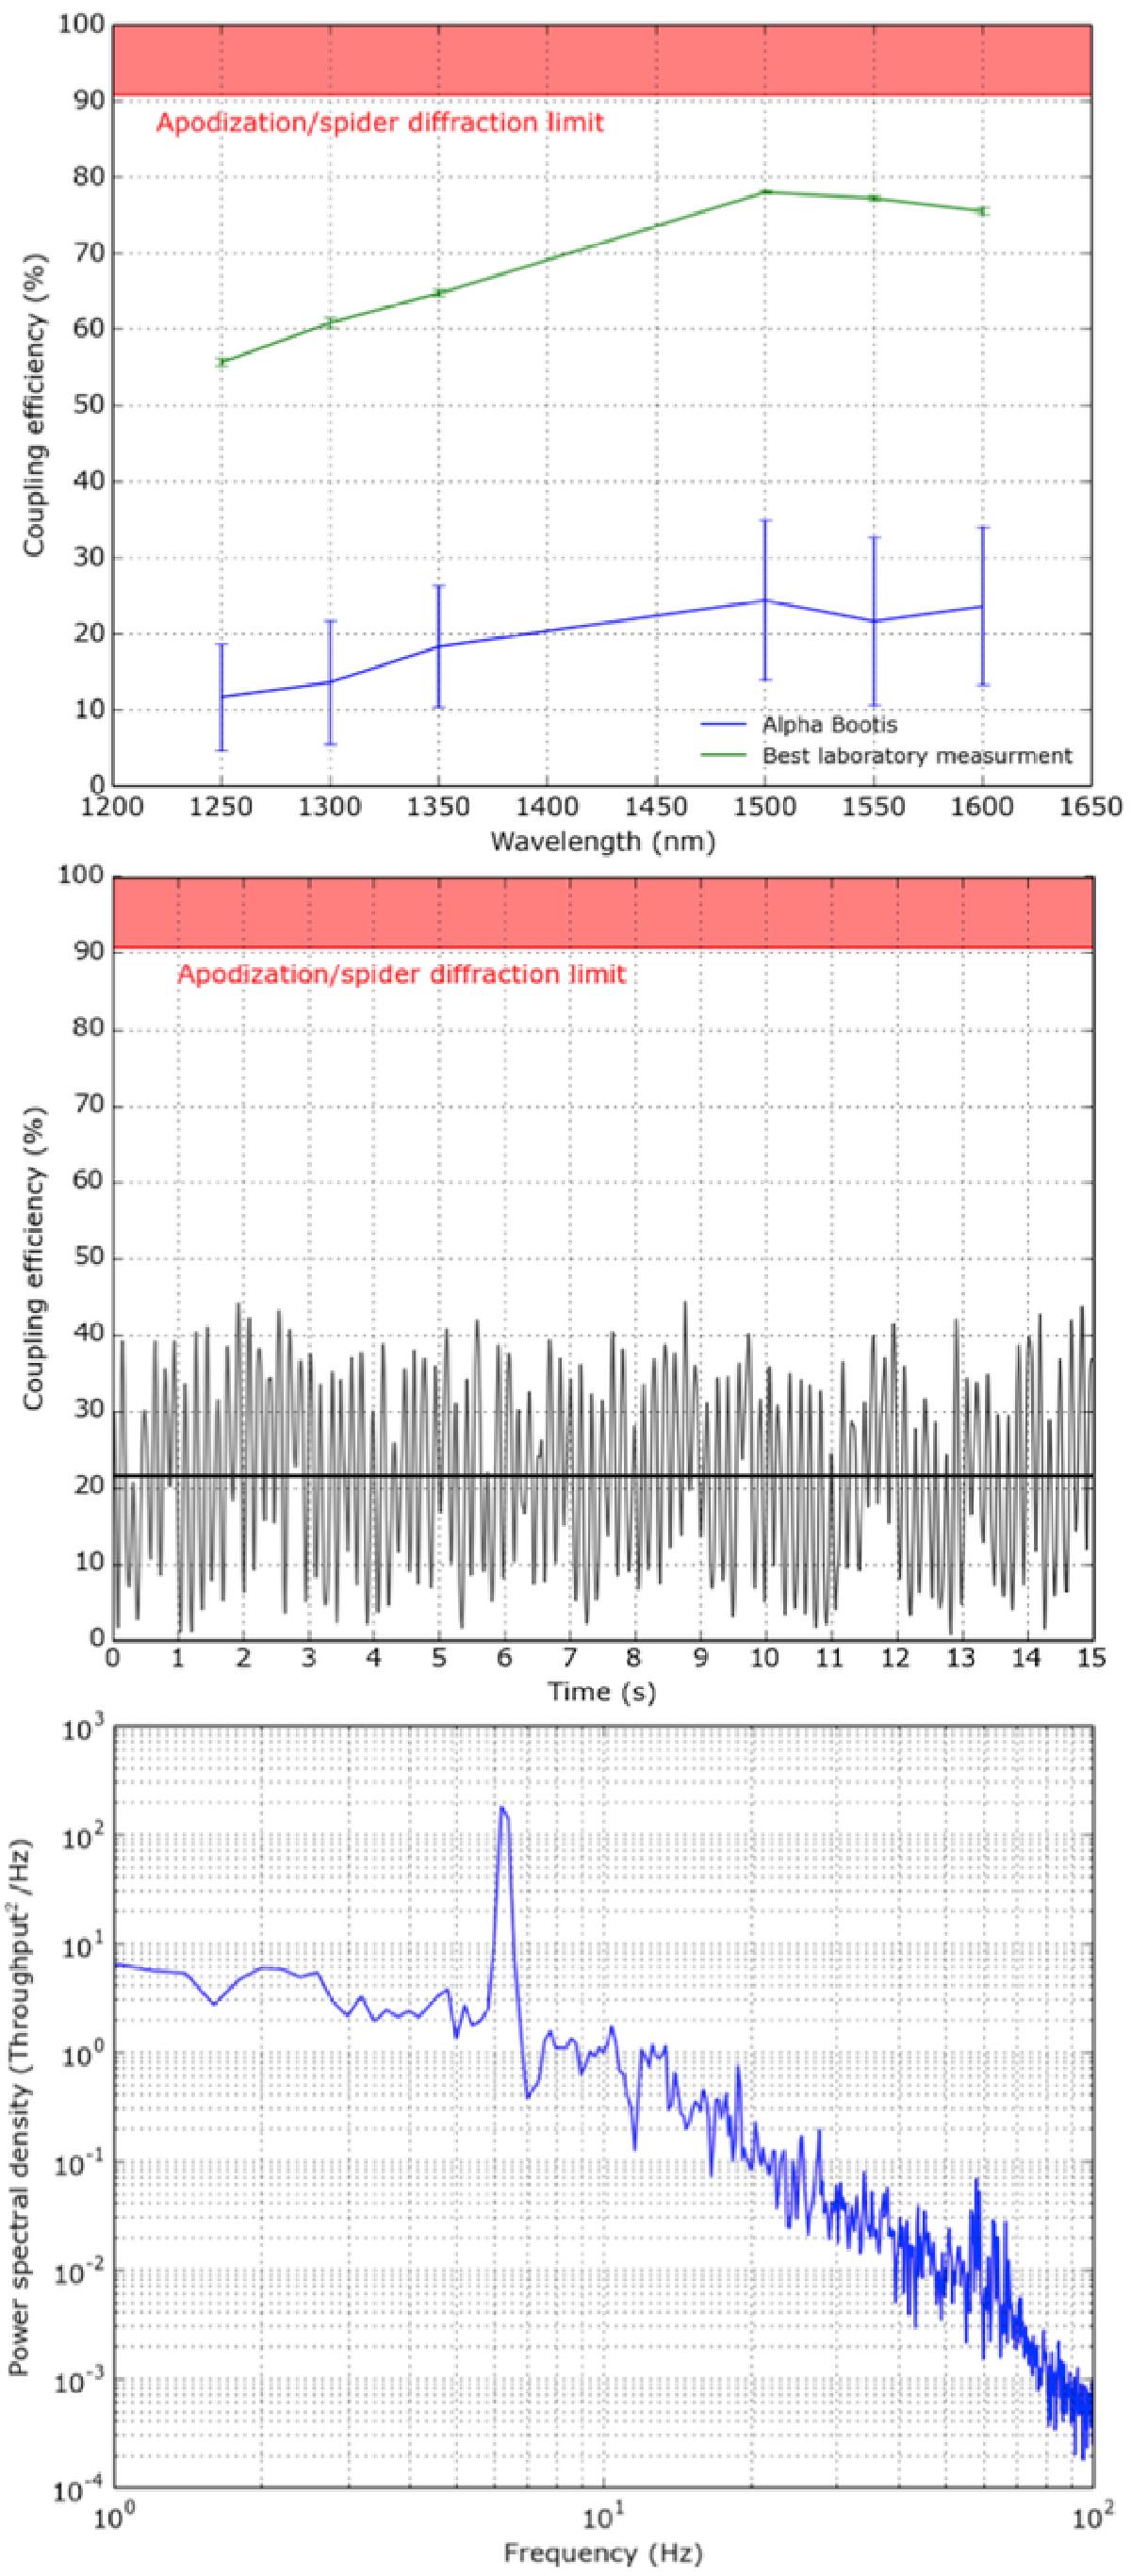
Top: coupling as a function of wavelength (target: Alpha Bootis (Arcturus) taken on the night of the 18th of March). The green line shows the best laboratory result obtained with no wavefront error applied. Middle: time series of the 1550 nm spectral channel. The dark solid line shows the mean over the 15 s data-collection period. Bottom: a PSD of the time series in the middle panel.
Current usage metrics show cumulative count of Article Views (full-text article views including HTML views, PDF and ePub downloads, according to the available data) and Abstracts Views on Vision4Press platform.
Data correspond to usage on the plateform after 2015. The current usage metrics is available 48-96 hours after online publication and is updated daily on week days.
Initial download of the metrics may take a while.