Free Access
Fig. 1
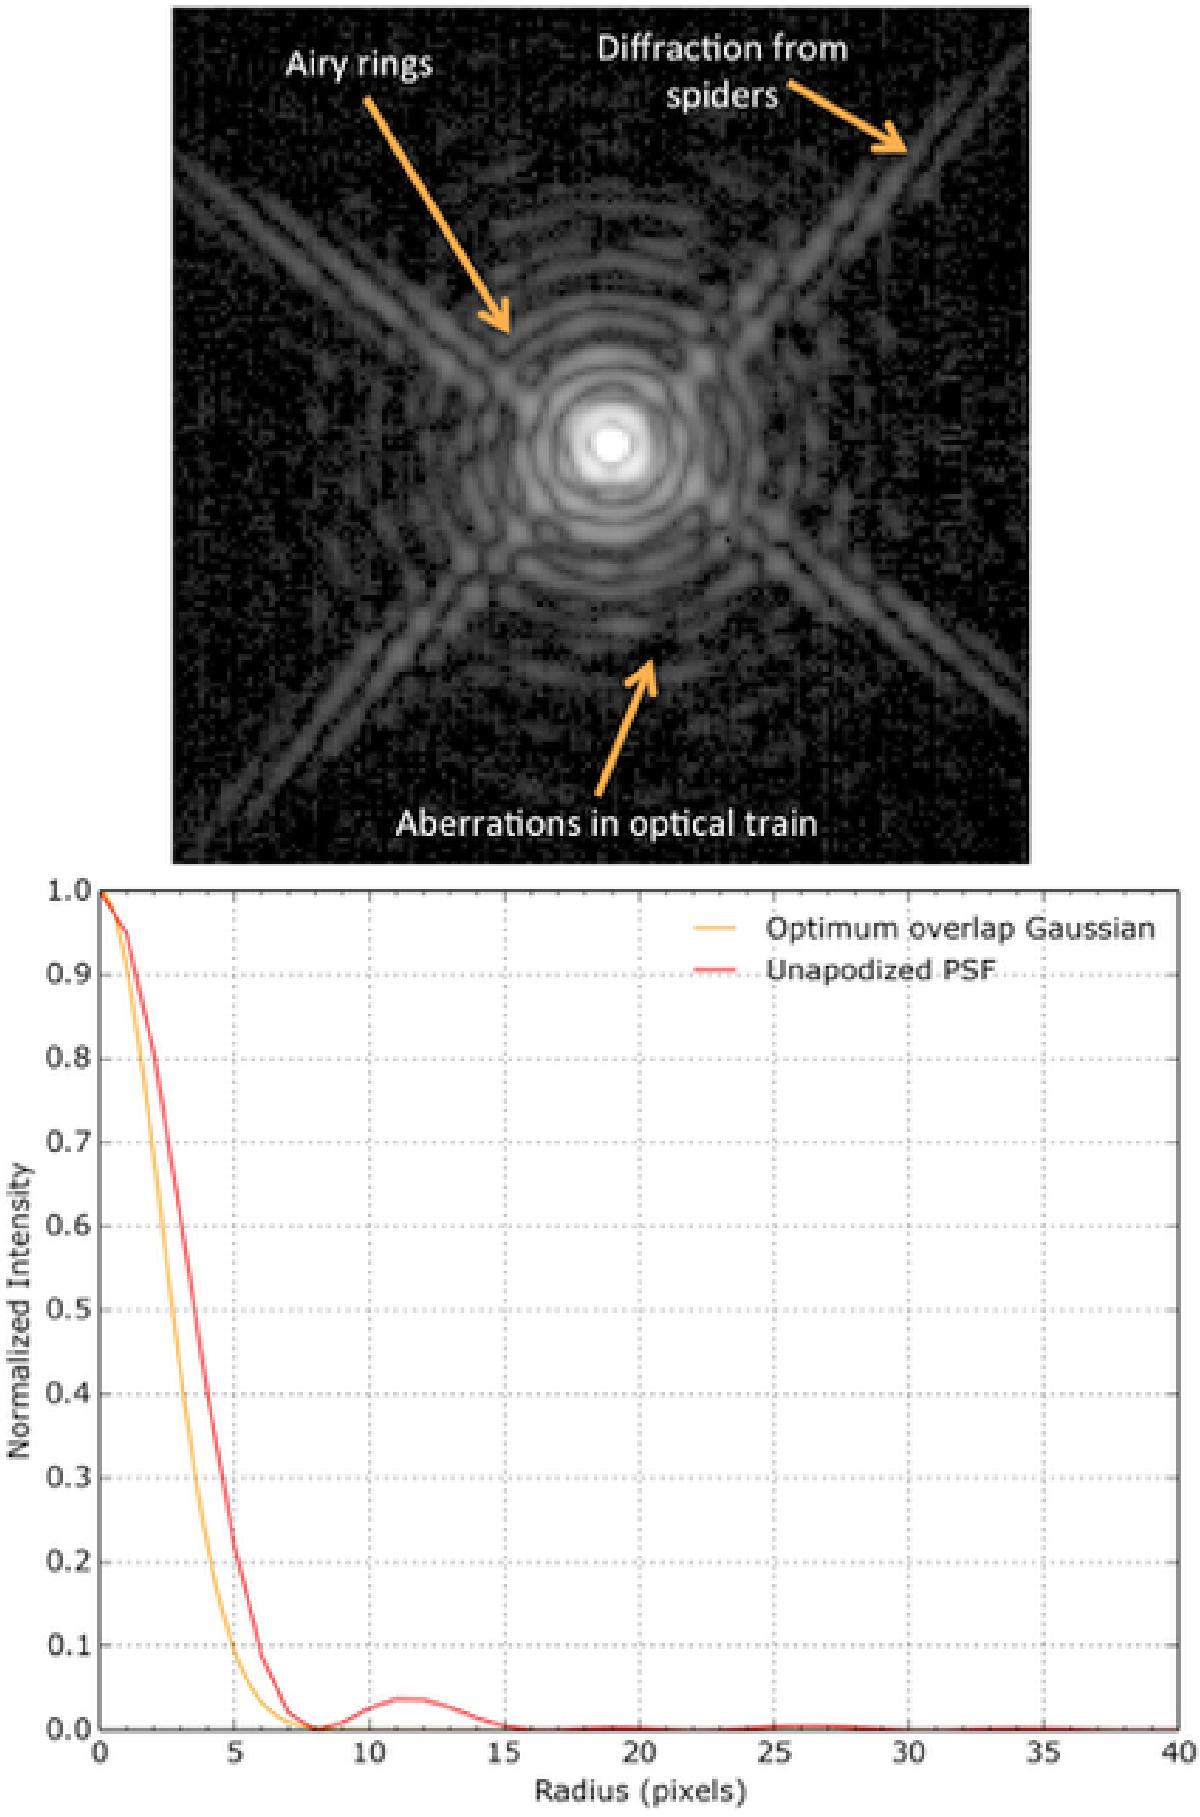
Top: laboratory image of the PSF of the Subaru Telescope in the H-band. Various features which are caused by diffraction or aberrations are highlighted. Bottom: cross-sectional line profile of an Airy pattern and the optimum fitting Gaussian.
Current usage metrics show cumulative count of Article Views (full-text article views including HTML views, PDF and ePub downloads, according to the available data) and Abstracts Views on Vision4Press platform.
Data correspond to usage on the plateform after 2015. The current usage metrics is available 48-96 hours after online publication and is updated daily on week days.
Initial download of the metrics may take a while.