Fig. 6
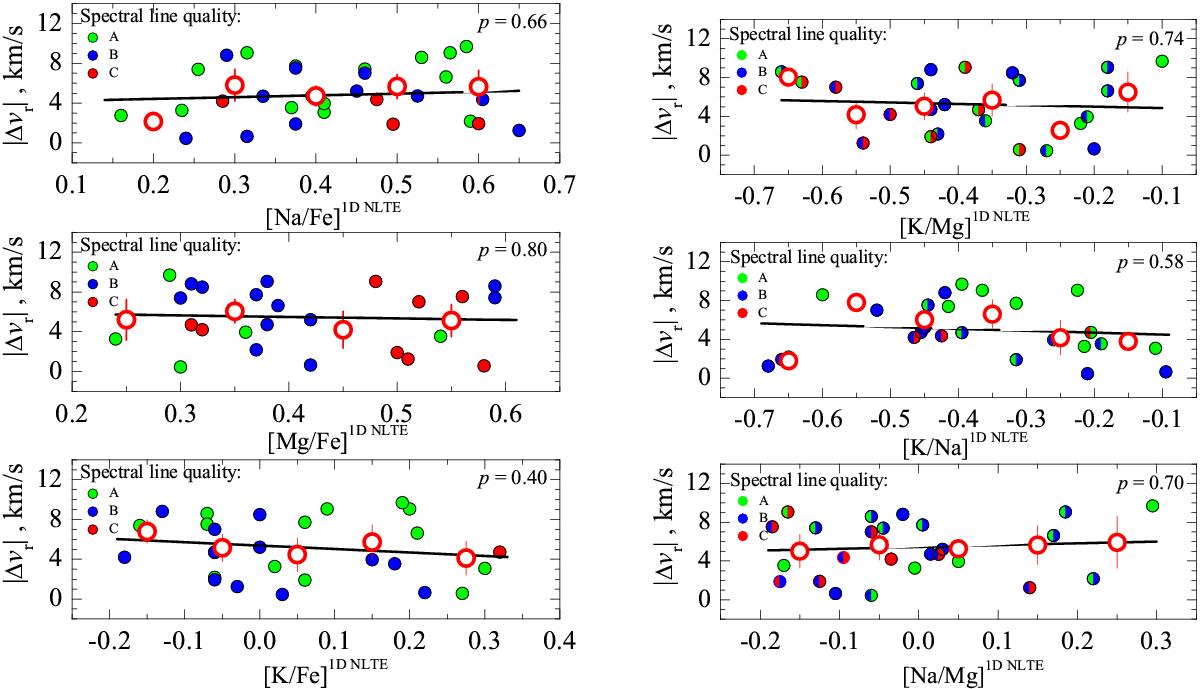
Absolute radial velocities of RGB stars in 47 Tuc, |Δvr|, plotted versus the abundance (left) and abundance-abundance ratios (right) of Na, Mg, and K. Measurements of individual stars are shown as small filled circles while the absolute radial velocities averaged in 0.1 dex-wide non-overlapping abundance bins are plotted as large open circles (error bars in the latter case measure RMS scatter of |Δvr| in a given abundance bin). Symbol color denotes quality (class) of the spectral lines from which the abundance was determined (see Fig. 4). Solid lines are linear fits to the data of individual stars, with the p-values (see text) marked in the corresponding panels.
Current usage metrics show cumulative count of Article Views (full-text article views including HTML views, PDF and ePub downloads, according to the available data) and Abstracts Views on Vision4Press platform.
Data correspond to usage on the plateform after 2015. The current usage metrics is available 48-96 hours after online publication and is updated daily on week days.
Initial download of the metrics may take a while.