Fig. 8
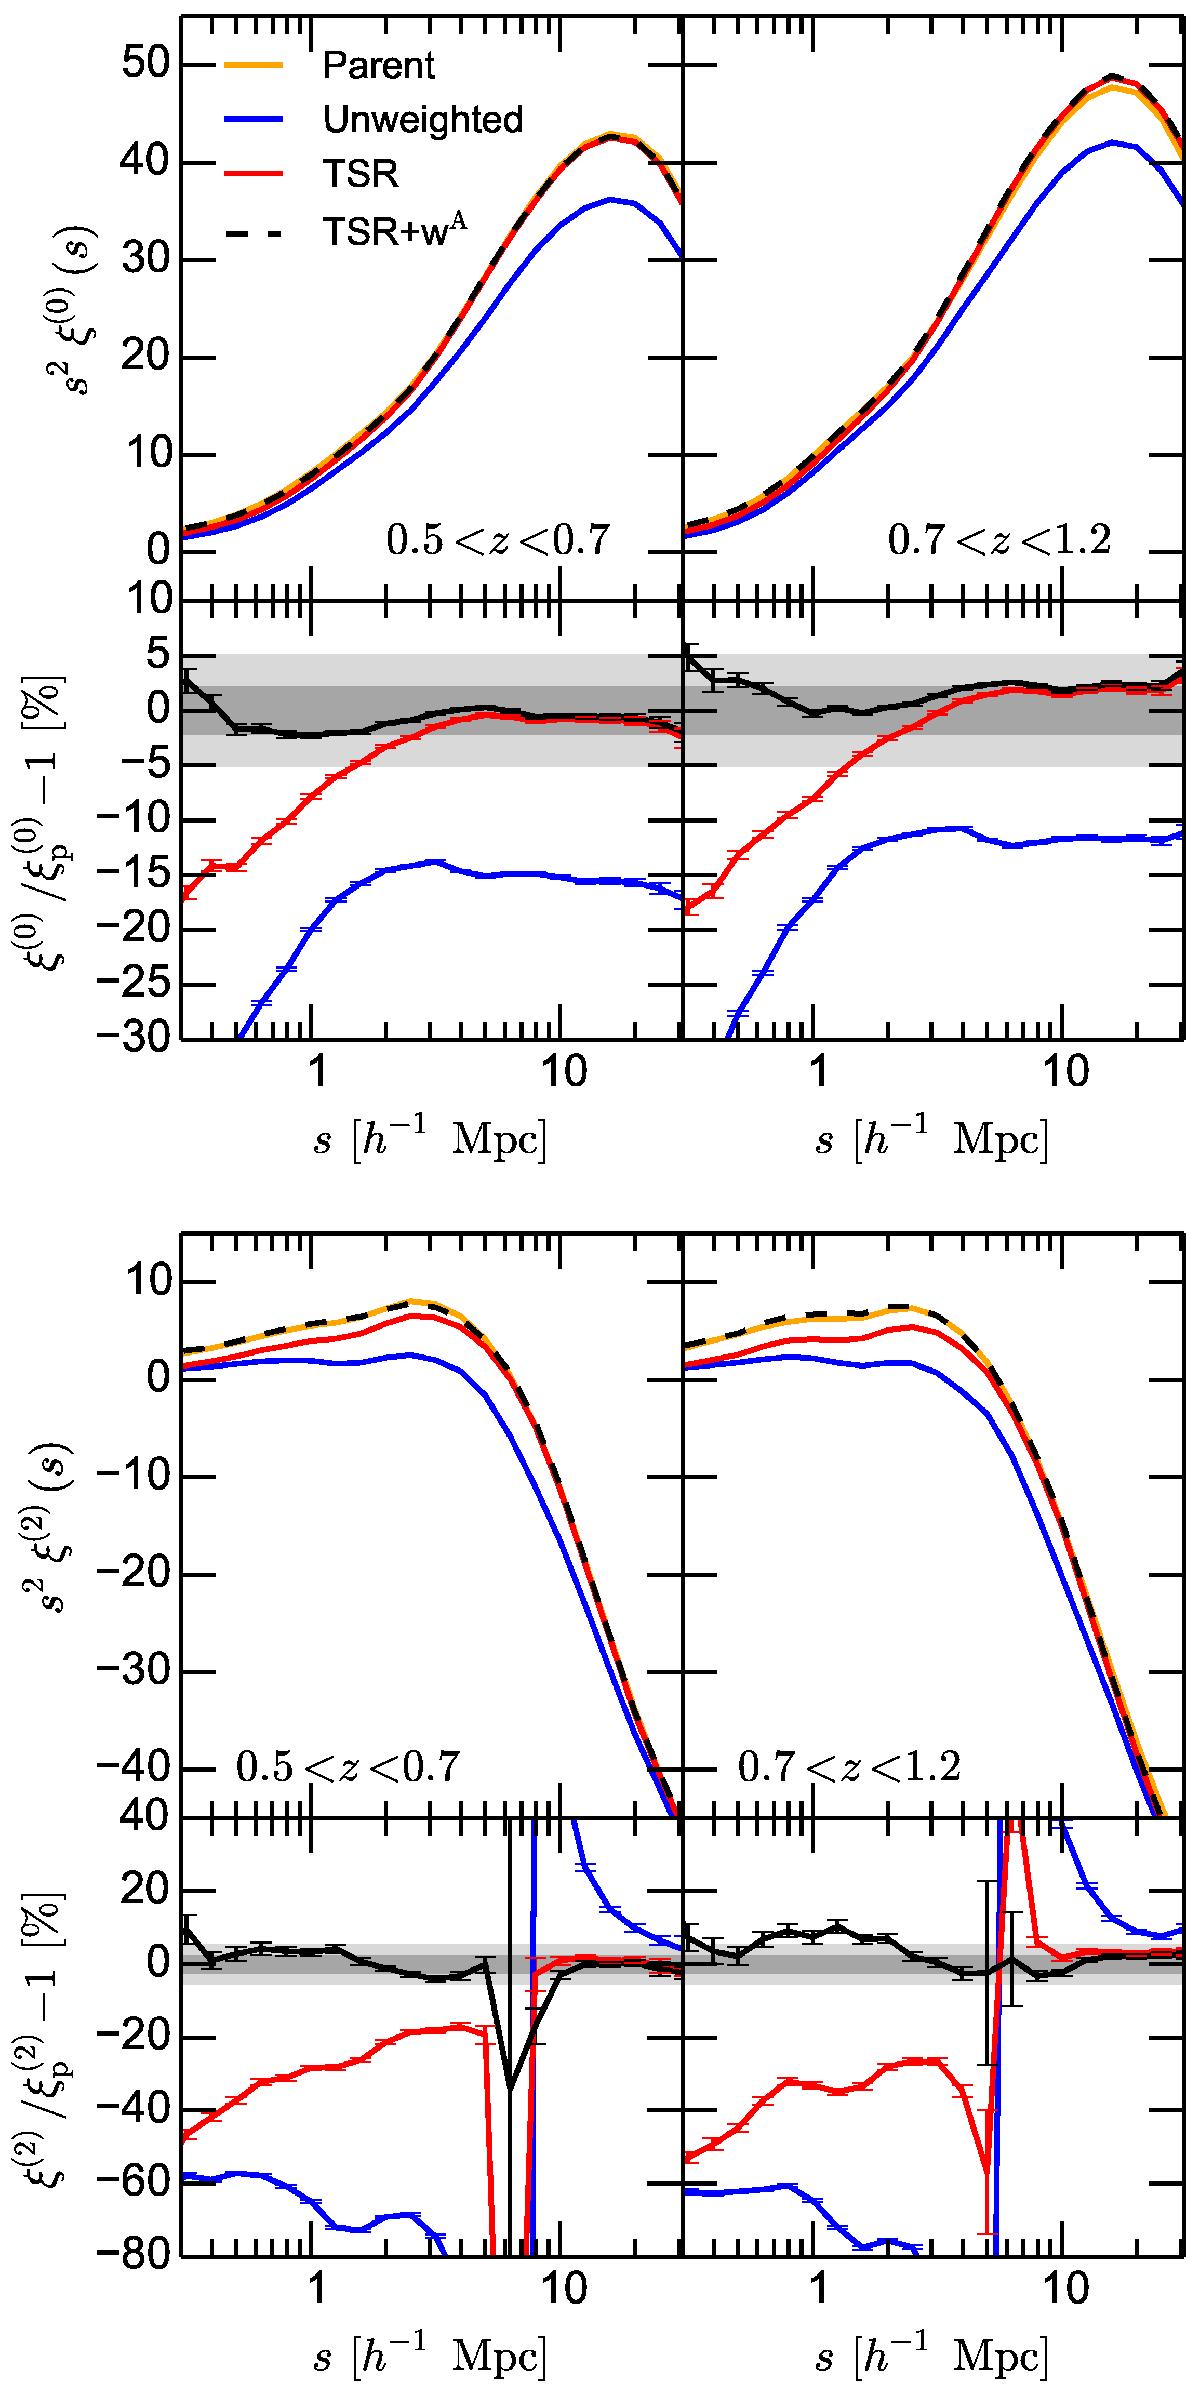
Impact of the target selection effects and their correction on the amplitude of the monopole (left) and quadrupole (right) of the redshift-space correlation function ξ(s,μ). Considering the mean over 153 mock samples, in the bottom panel we plot the fractional deviation of the multipoles measured with the observed sample from those obtained using the parent catalogue.
Current usage metrics show cumulative count of Article Views (full-text article views including HTML views, PDF and ePub downloads, according to the available data) and Abstracts Views on Vision4Press platform.
Data correspond to usage on the plateform after 2015. The current usage metrics is available 48-96 hours after online publication and is updated daily on week days.
Initial download of the metrics may take a while.