Fig. 6
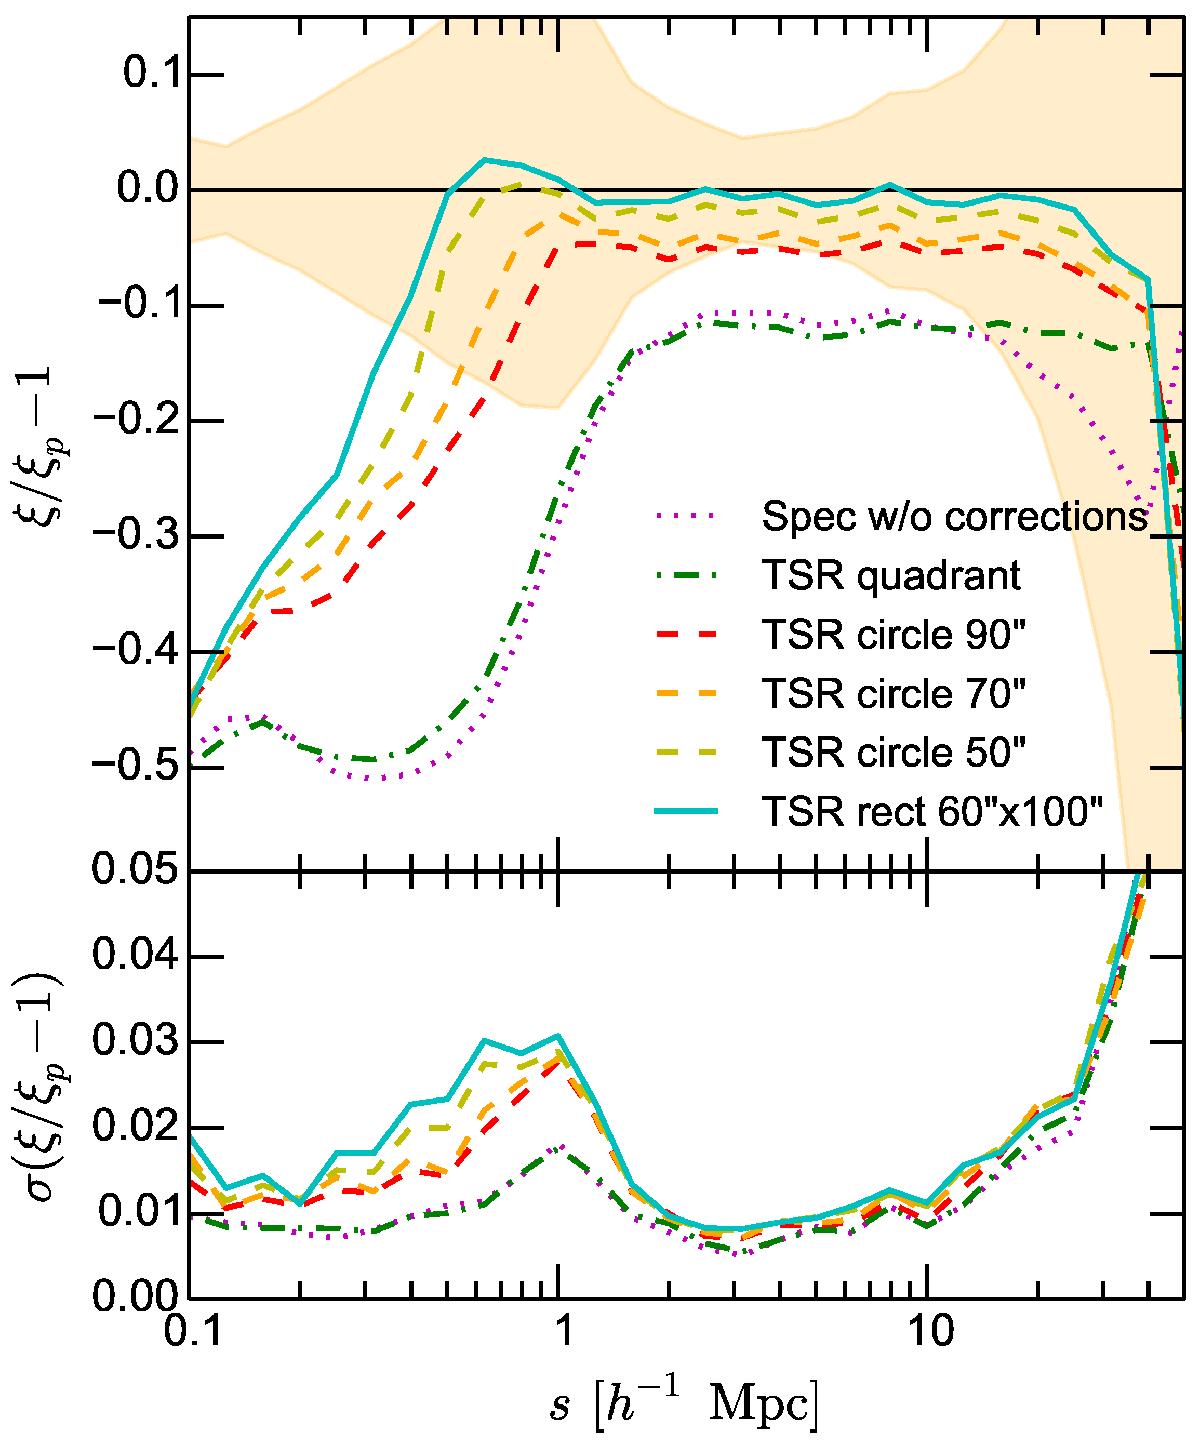
Optimising the correction for the Target Sampling Rate on large-scales; the tests are based on the mean of 153 mock samples. Top: systematic error on the real-space two-point correlation function introduced by the TSR (dotted line), confronted to the results of different strategies to estimate its local value and the corresponding weight (see text for details). Circular apertures with varying radius (r = 90, 70 and 50 arcsec), and a rectangular aperture 60 × 100 arcsec2 are compared. The dot-dashed line also shows the result of using a weight based only on the quadrant-averaged TSR. Note that here the small-scale further correction based on Eq. (6) has not been applied yet. Bottom: corresponding scatter of the different corrections. To allow comparison with the systematic error, this is also reported, for the rectangular aperture, as the shaded area in the top panel.
Current usage metrics show cumulative count of Article Views (full-text article views including HTML views, PDF and ePub downloads, according to the available data) and Abstracts Views on Vision4Press platform.
Data correspond to usage on the plateform after 2015. The current usage metrics is available 48-96 hours after online publication and is updated daily on week days.
Initial download of the metrics may take a while.