Fig. 4
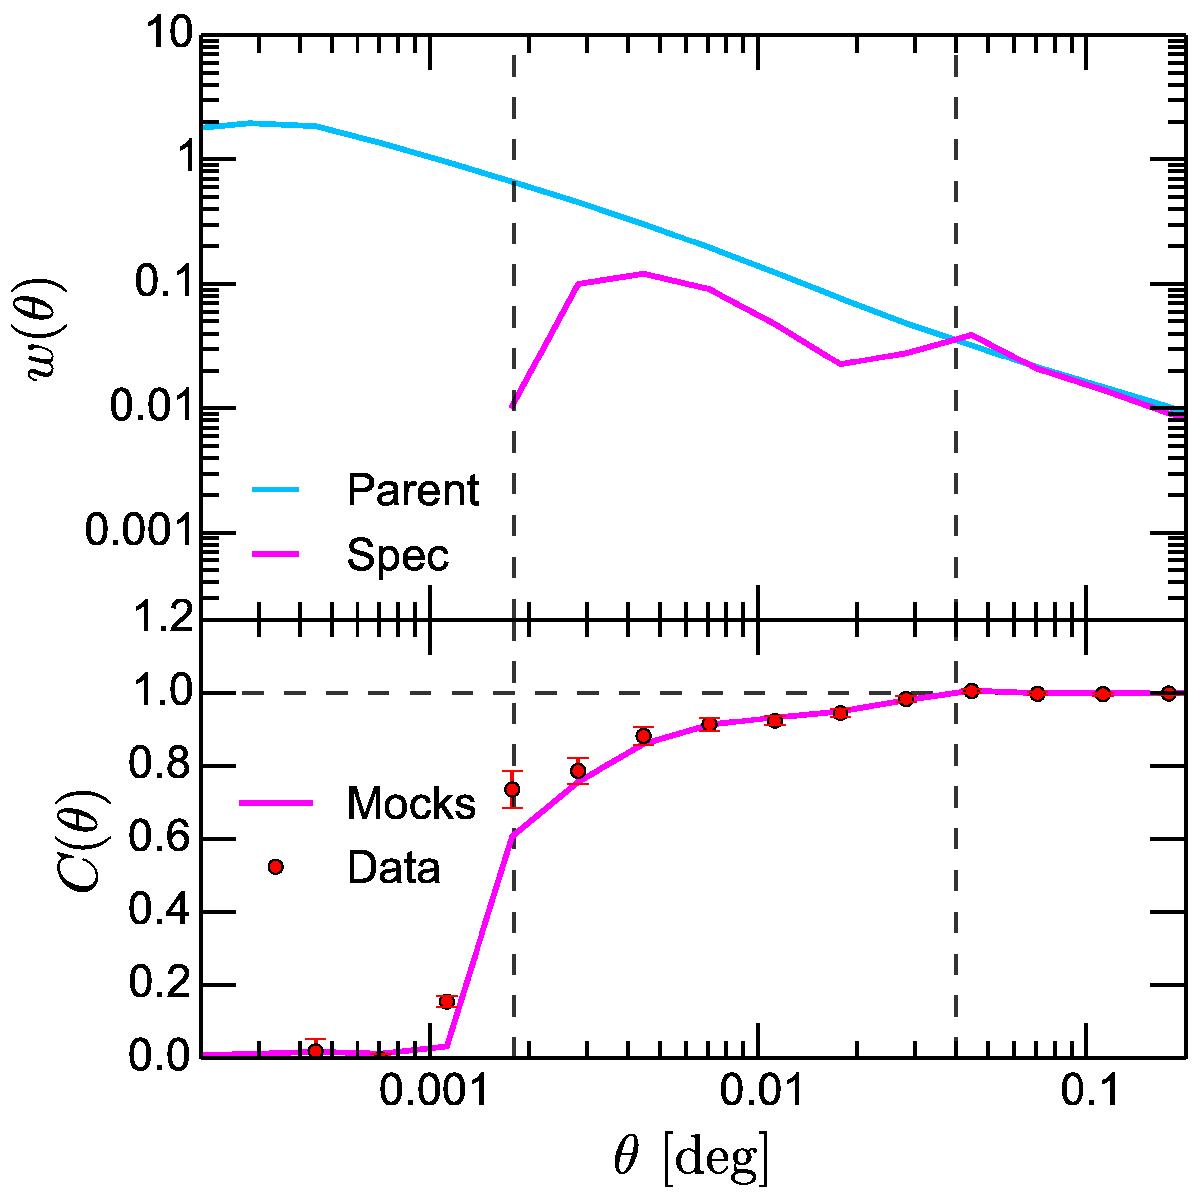
Top: angular correlation function measured from the VIPERS W1 mock samples. In order to enhance the signal-to-noise ratio, we show only the mean over 153 realisations. The angular correlation function of the parent and selected sample are shown with a cyan and magenta line, respectively. The two dashed vertical lines indicate the typical angular size of the slits and the raw spectra. Bottom: the completeness function, extracted from the mean of the 153 W1 mock samples (magenta line), is shown. The corresponding quantity measured from the VIPERS dataset is shown with red circles.
Current usage metrics show cumulative count of Article Views (full-text article views including HTML views, PDF and ePub downloads, according to the available data) and Abstracts Views on Vision4Press platform.
Data correspond to usage on the plateform after 2015. The current usage metrics is available 48-96 hours after online publication and is updated daily on week days.
Initial download of the metrics may take a while.