Fig. 3
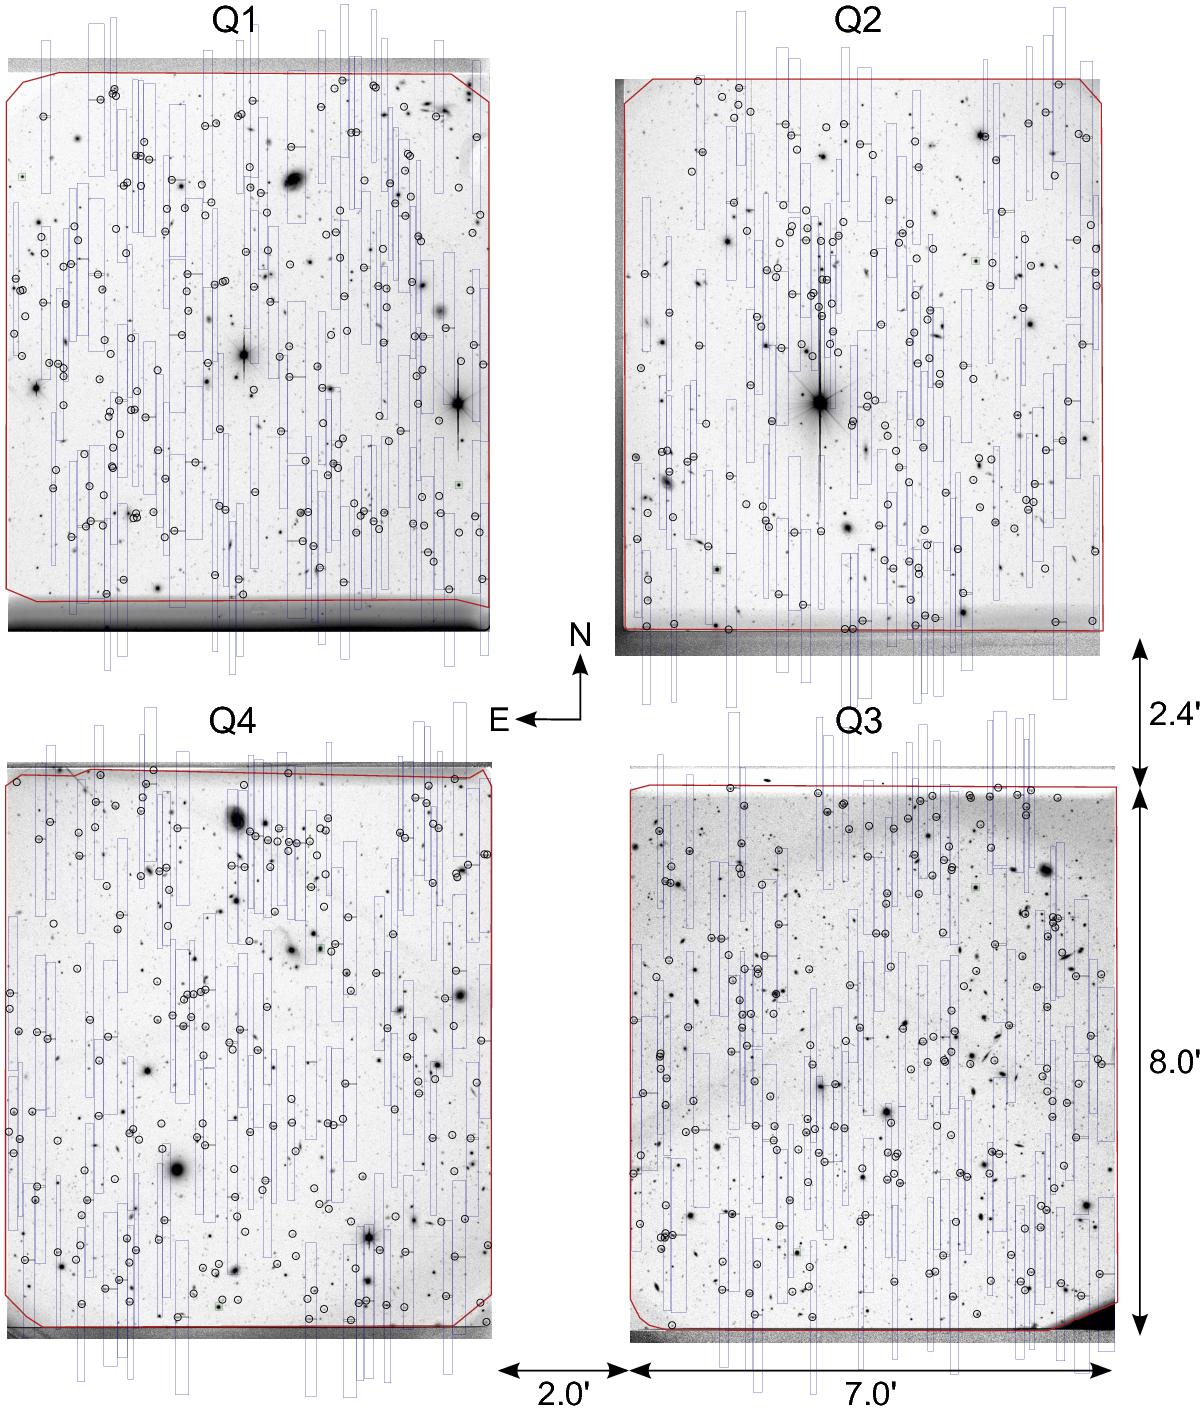
Diagram of the slit lay-out of a typical VIMOS pointing of the VIPERS survey (W1P082 in this case) superimposed on the actual DSS finding chart. The open circles with the tiny horizontal slits mark the target objects. The vertical rectangles define the area where the resulting spectrum falls once the dispersing element (grism) is inserted.
Current usage metrics show cumulative count of Article Views (full-text article views including HTML views, PDF and ePub downloads, according to the available data) and Abstracts Views on Vision4Press platform.
Data correspond to usage on the plateform after 2015. The current usage metrics is available 48-96 hours after online publication and is updated daily on week days.
Initial download of the metrics may take a while.