Fig. 17
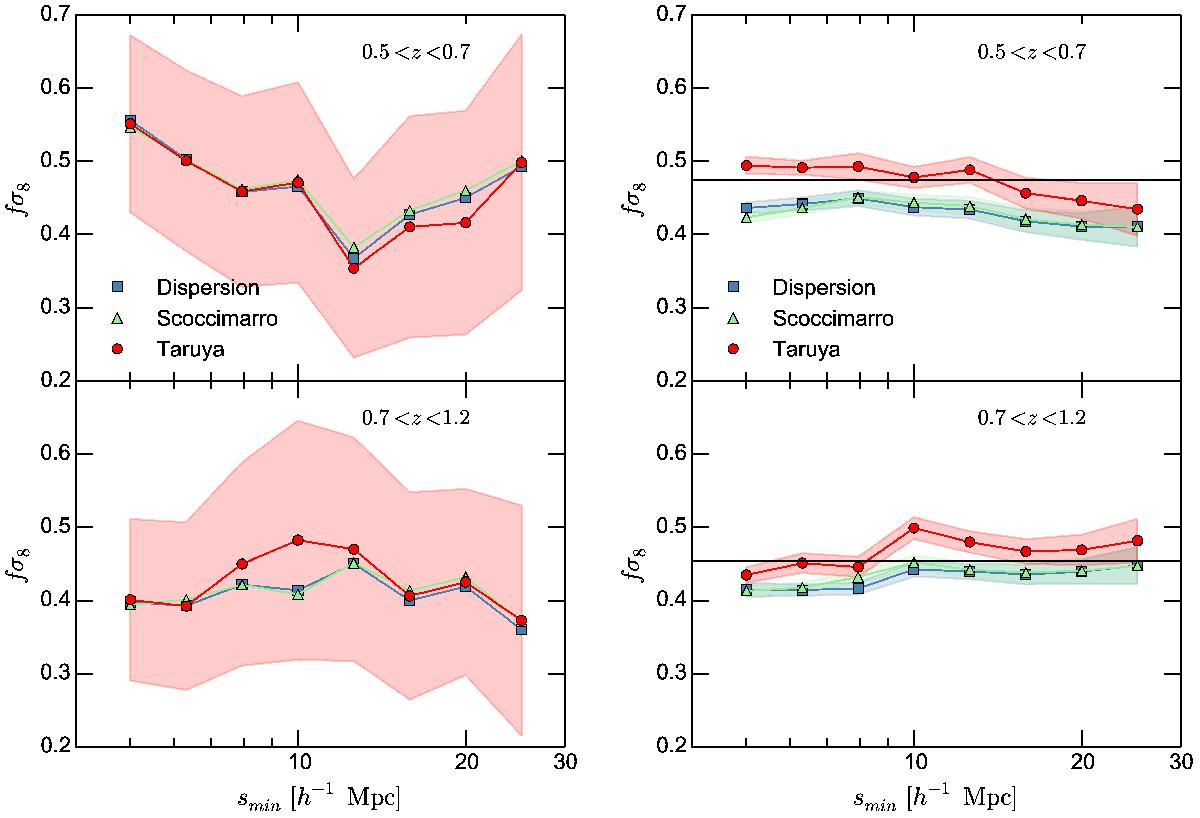
Left panels: measured values of fσ8 from the VIPERS survey in the two redshift bins, using the TNS model in its optimal set-up that we derived in section 8 (double damping factor: free Lorentzian + fixed Gaussian), as a function of the minimum fitting scale smin. The maximum fitting scale smax is always fixed at 50 h-1 Mpc. The shaded area gives the statistical error at each smin for the TNS model, as derived from the mocks. Right panels: the same measurements performed on the average of the mocks, i.e. plotting the results of Fig. 15 but showing explicitly the recovered values of fσ8, to ease comparison with the data results on the left.
Current usage metrics show cumulative count of Article Views (full-text article views including HTML views, PDF and ePub downloads, according to the available data) and Abstracts Views on Vision4Press platform.
Data correspond to usage on the plateform after 2015. The current usage metrics is available 48-96 hours after online publication and is updated daily on week days.
Initial download of the metrics may take a while.