Fig. 11
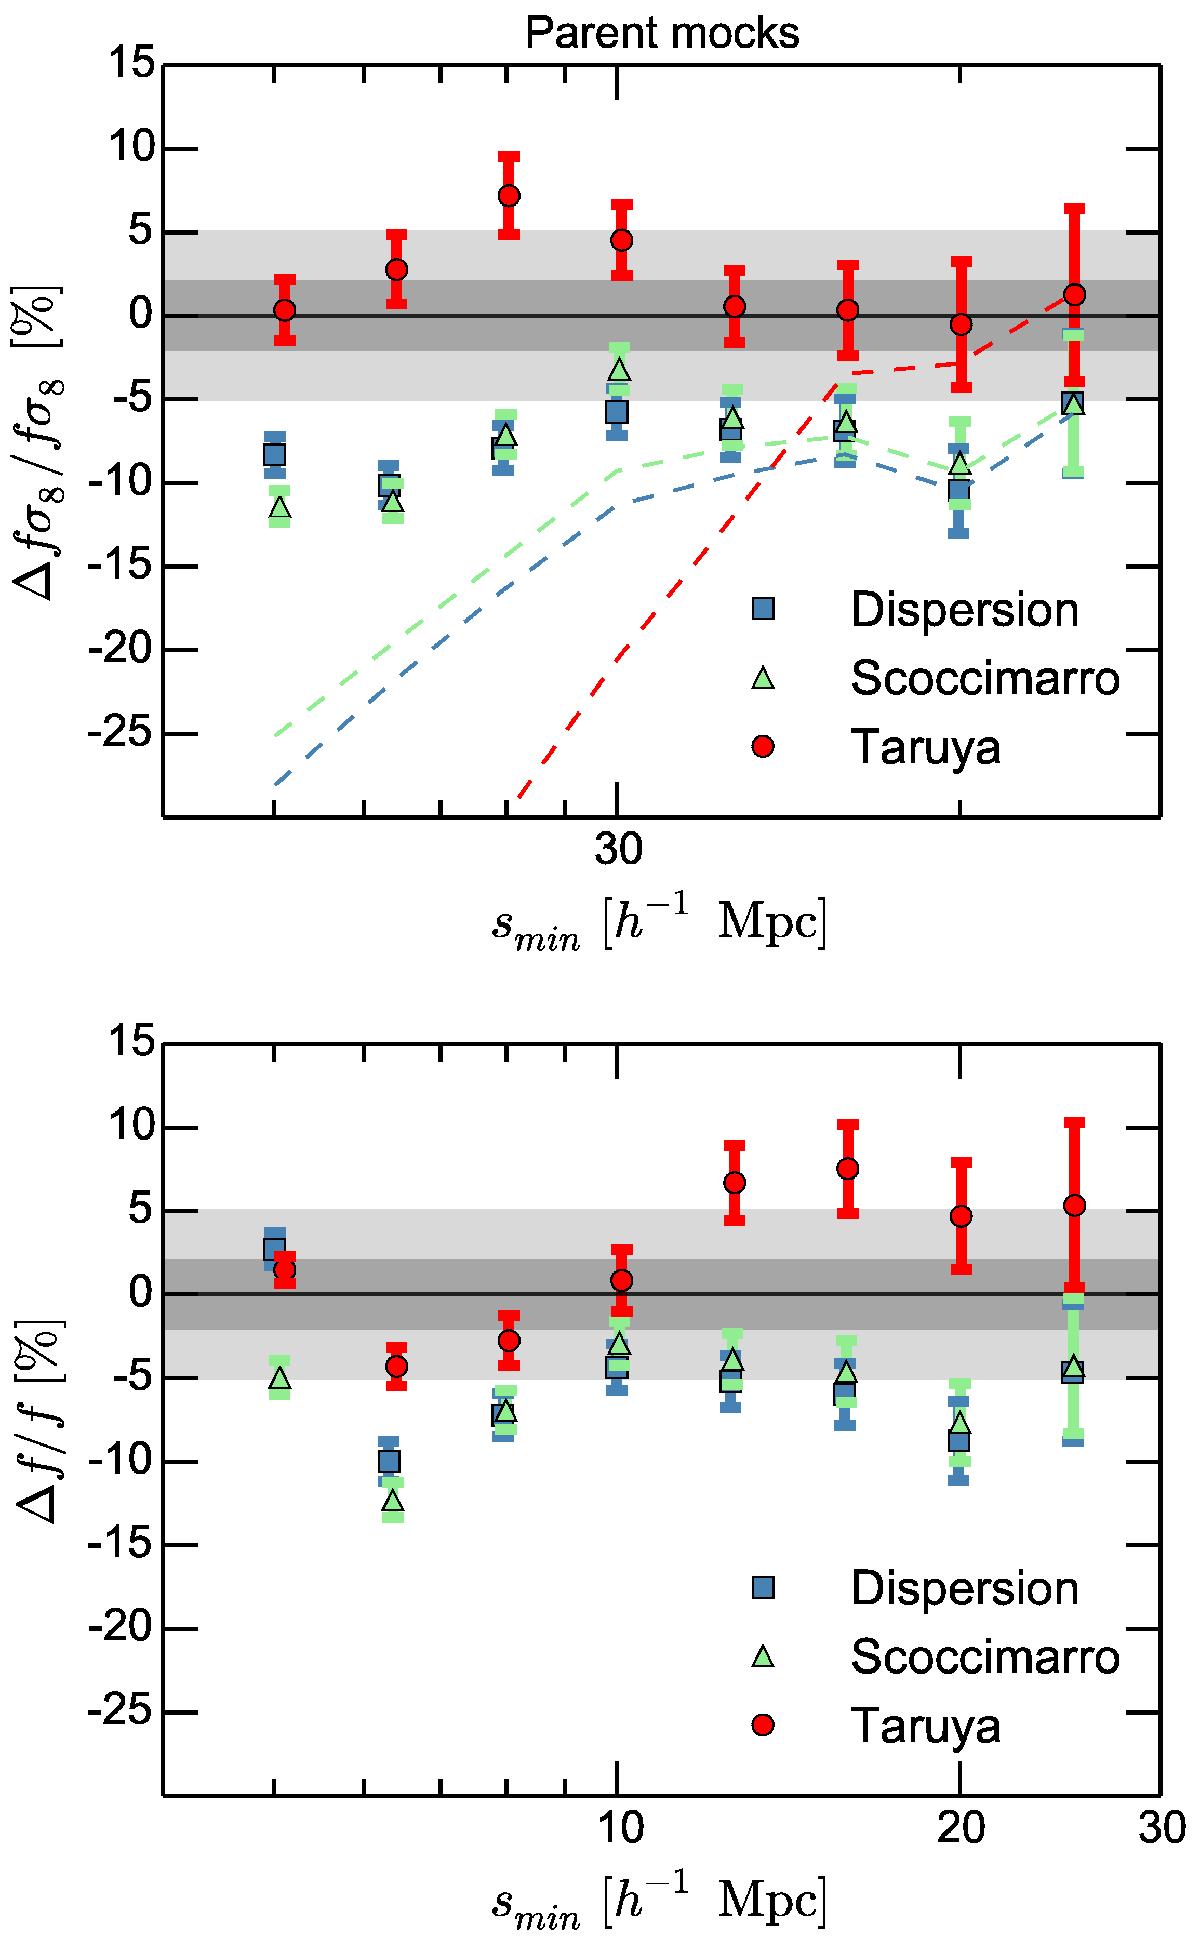
Relative systematic error on the measurement of the linear growth rate from the mean of 153 mock samples, as a function of the minimum fitting scale smin, using the three models discussed in the text. The maximum scales fitted smax is always fixed at 50 h-1 Mpc. Here the parent mock samples are used to focus on the intrinsic performances of the models. The filled symbols correspond to the use of a Lorentzian form for the non-linear damping factor in the models, whereas dashed lines correspond to a Gaussian form. In the top panel the full model as described in the text has been used. In the bottom panel, symbols are as above, but σ8 (and thus the shape of the non-linear density and velocity divergence power spectra) has been fixed to the cosmology of the mock samples to test the effectiveness of the RSD model under ideal conditions. In this case, reducing the degrees of freeedom does reduce the statistical error bars, but for the TNS model seems to introduce a positive systematic error of ~5%, this is also the case for smin as large as 25 h-1 Mpc.
Current usage metrics show cumulative count of Article Views (full-text article views including HTML views, PDF and ePub downloads, according to the available data) and Abstracts Views on Vision4Press platform.
Data correspond to usage on the plateform after 2015. The current usage metrics is available 48-96 hours after online publication and is updated daily on week days.
Initial download of the metrics may take a while.