Fig. 10
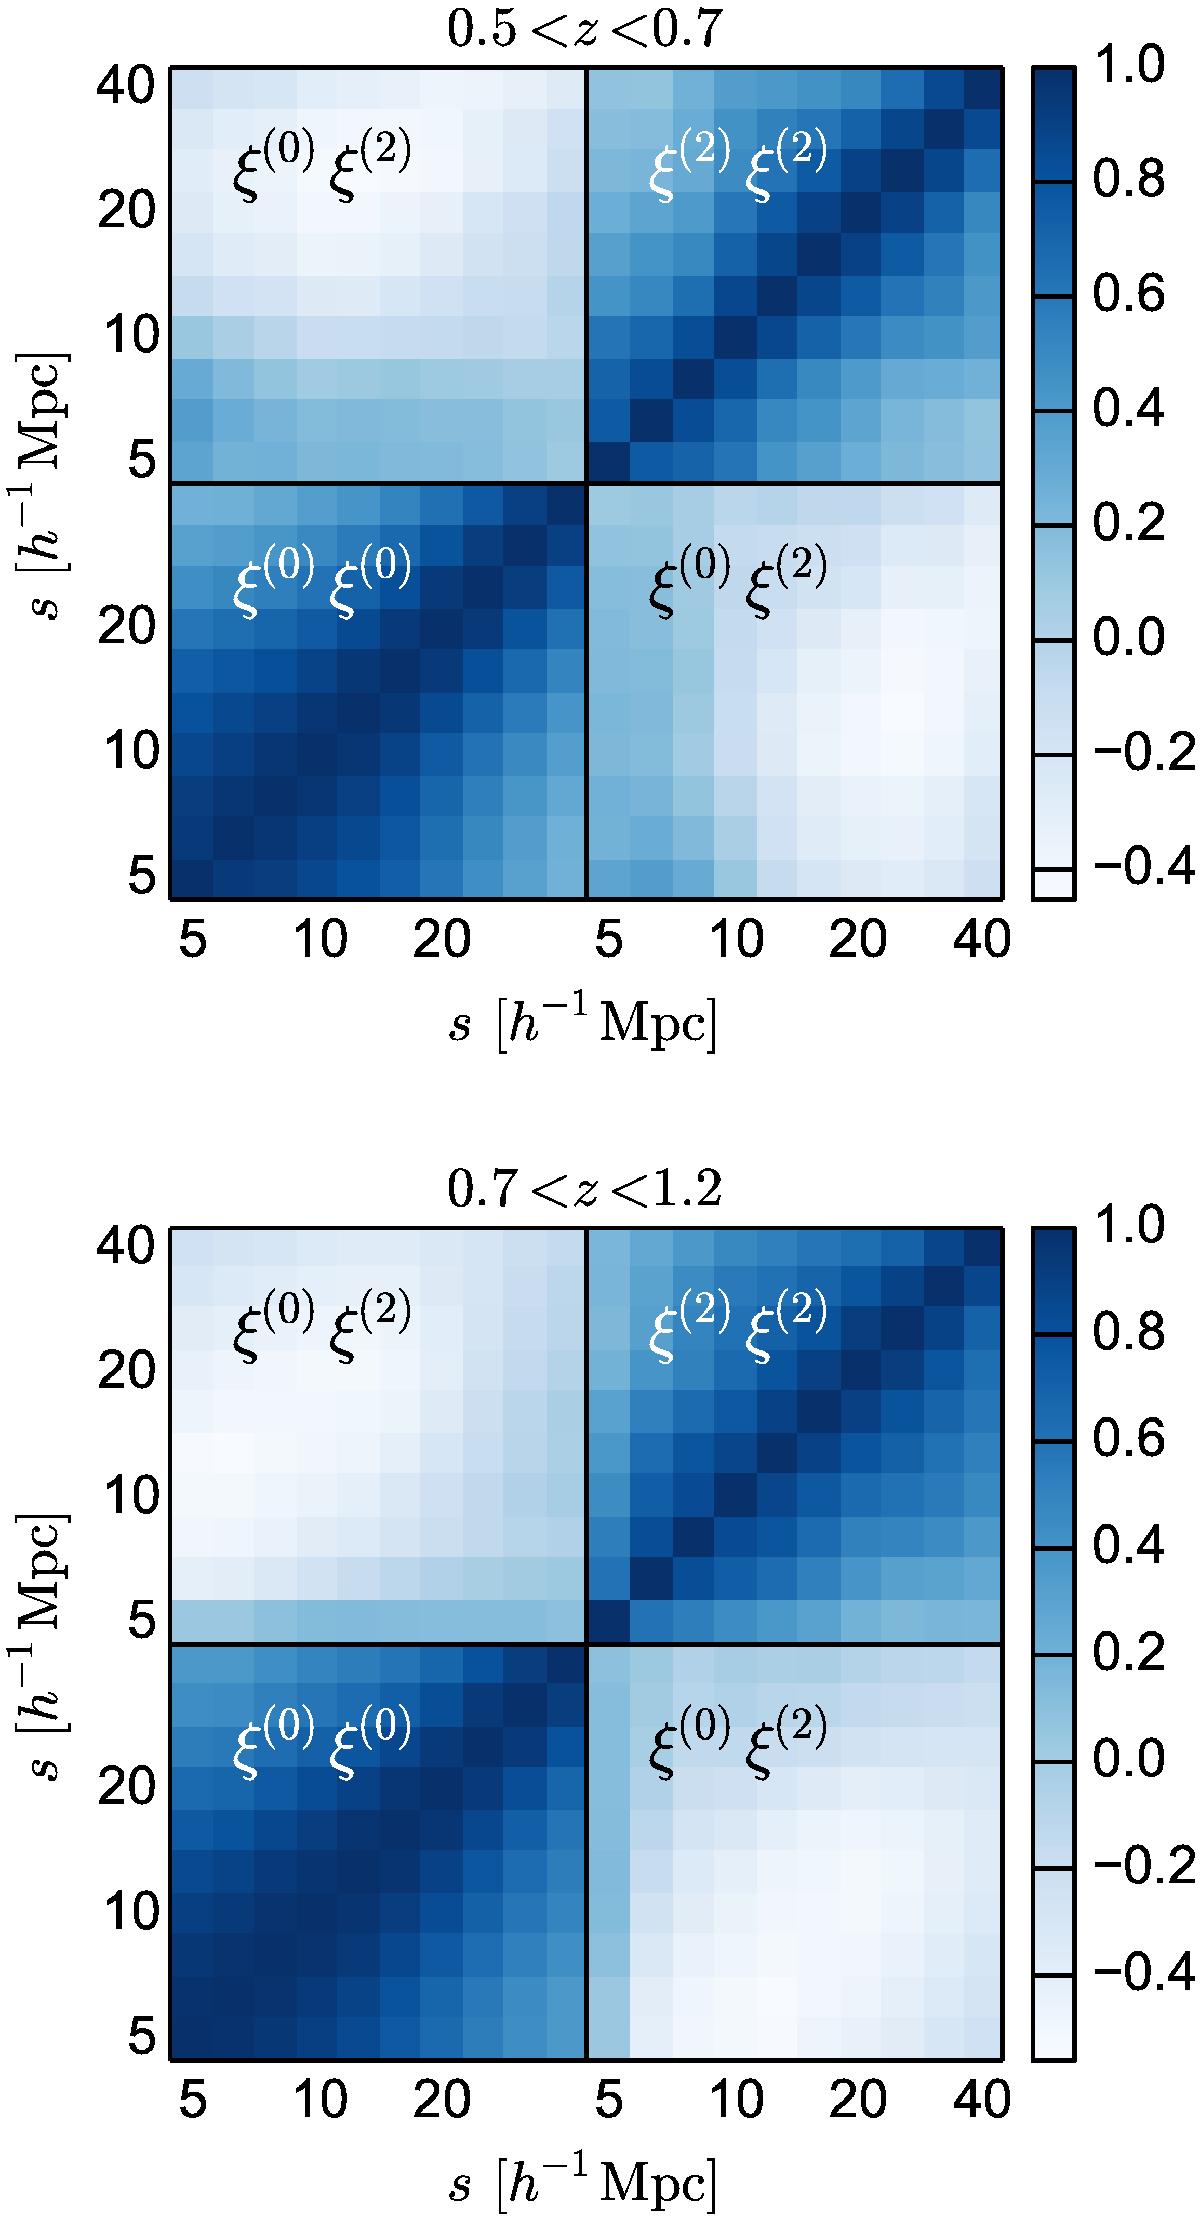
Correlation matrices for the combined monopole-quadrupole data vector in the low- (top) and high- (bottom) redshift bin. Correlation matrices are computed as ![]() , where C is the covariance matrix estimated from a set of 153 independent mock samples. The bottom left and top right squares correspond to the auto-covariance of the monopole s2ξ(0) and the quadrupole s2ξ(2), respectively, while the remaining squares show the cross-covariance terms. The scales under consideration range from smin = 5 h-1 Mpc to smax = 50 h-1 Mpc (from left to right).
, where C is the covariance matrix estimated from a set of 153 independent mock samples. The bottom left and top right squares correspond to the auto-covariance of the monopole s2ξ(0) and the quadrupole s2ξ(2), respectively, while the remaining squares show the cross-covariance terms. The scales under consideration range from smin = 5 h-1 Mpc to smax = 50 h-1 Mpc (from left to right).
Current usage metrics show cumulative count of Article Views (full-text article views including HTML views, PDF and ePub downloads, according to the available data) and Abstracts Views on Vision4Press platform.
Data correspond to usage on the plateform after 2015. The current usage metrics is available 48-96 hours after online publication and is updated daily on week days.
Initial download of the metrics may take a while.