Fig. 1
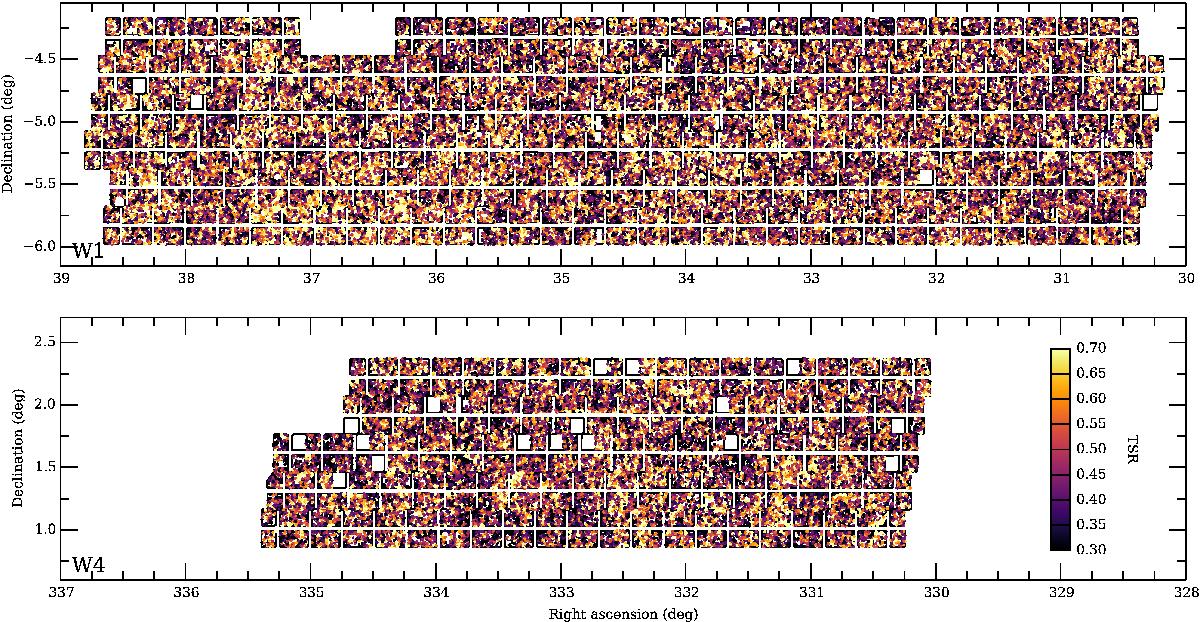
Footprint of the VIPERS observations within the W1 (top) and W4 (bottom) fields, as reconstructed from the final galaxy sample. The VIMOS pointings and quadrants are indicated by black rectangles. Galaxies are colour coded according to their value of the target sampling rate (TSR: see Sect. 4), which can be considered as a proxy for the inverse of the projected galaxy density field. Empty rectangles correspond to failed quadrants, for which the spectroscopic mask insertion failed or was incorrect, leading to no collection of data.
Current usage metrics show cumulative count of Article Views (full-text article views including HTML views, PDF and ePub downloads, according to the available data) and Abstracts Views on Vision4Press platform.
Data correspond to usage on the plateform after 2015. The current usage metrics is available 48-96 hours after online publication and is updated daily on week days.
Initial download of the metrics may take a while.