Free Access
Fig. 6
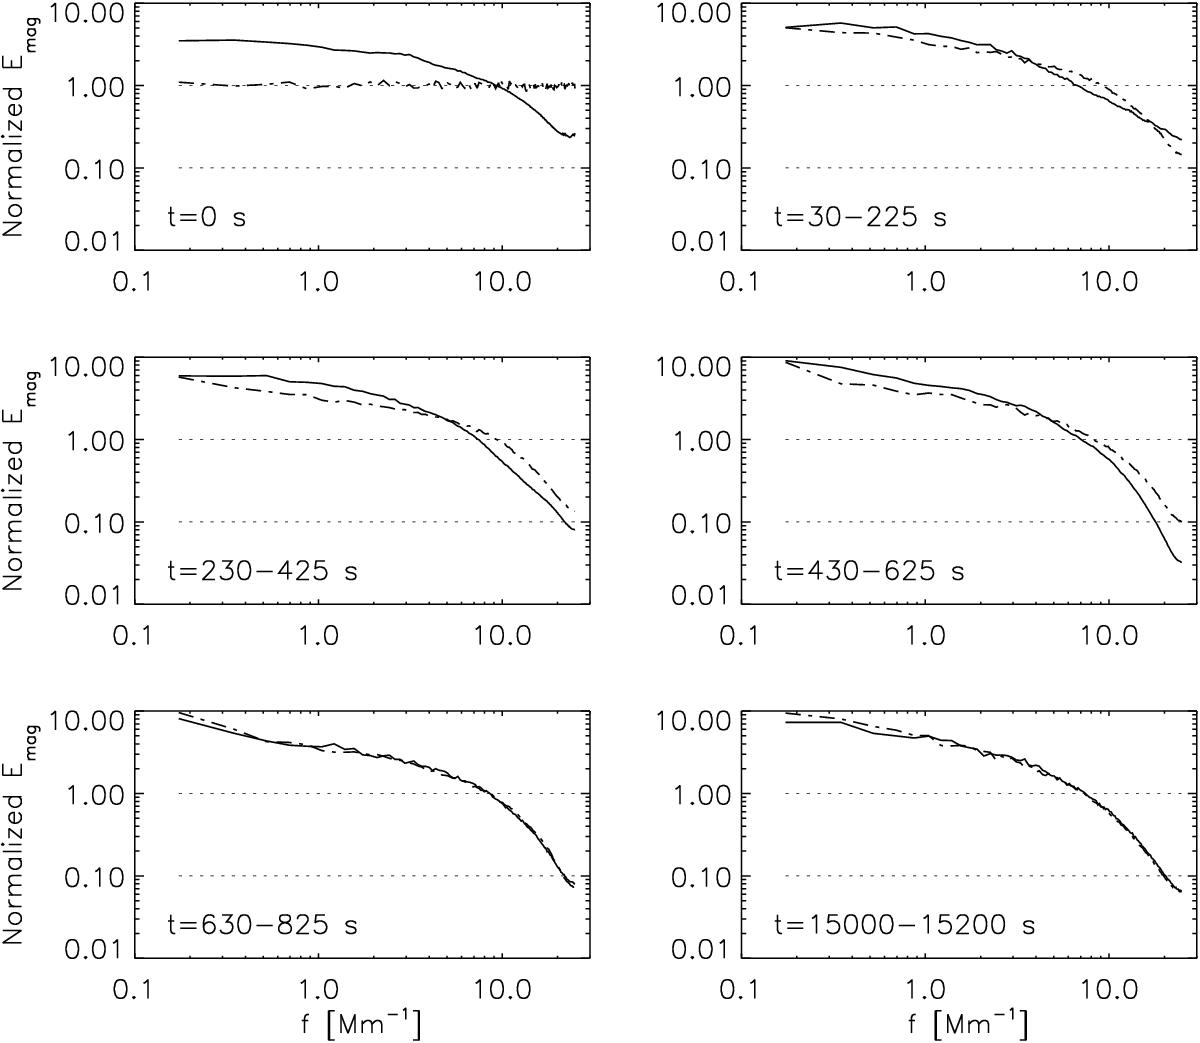
Time evolution of the magnetic energy power spectra in the B20 (solid lines) and R20 (dashed lines) runs. Time is indicated at each panel. In order to make the comparison, the spectra have been normalized in such a way that the total magnetic energy is constant at each time moment.
Current usage metrics show cumulative count of Article Views (full-text article views including HTML views, PDF and ePub downloads, according to the available data) and Abstracts Views on Vision4Press platform.
Data correspond to usage on the plateform after 2015. The current usage metrics is available 48-96 hours after online publication and is updated daily on week days.
Initial download of the metrics may take a while.