Fig. 4
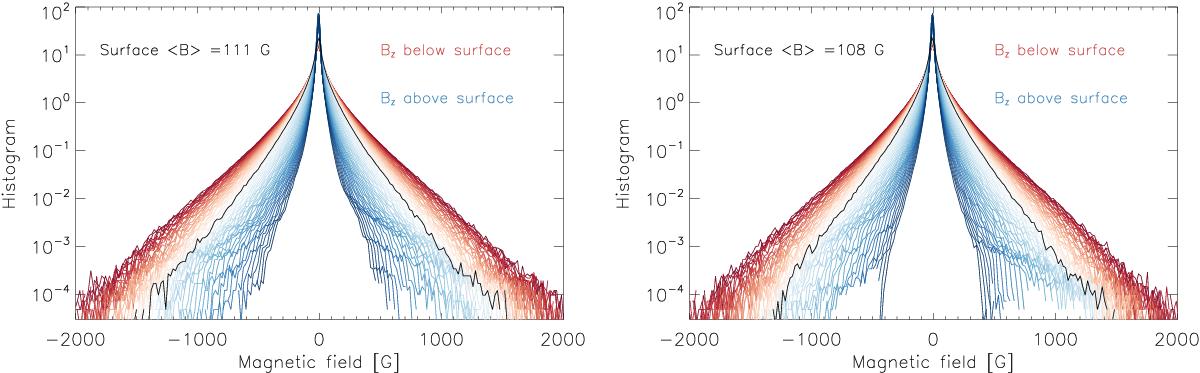
Left panel: histograms of the vertical magnetic field component, BZ, in the stationary dynamo phase of the run B20. The histograms in red colors refer to heights below the solar surface from −420 to 0 km; the histograms in blue colors refer to heights above the solar surface from 0 to 420 km. The black curve corresponds to the histogram of BZ at the solar surface τ5 = 1. Right panel: same, for run R20.
Current usage metrics show cumulative count of Article Views (full-text article views including HTML views, PDF and ePub downloads, according to the available data) and Abstracts Views on Vision4Press platform.
Data correspond to usage on the plateform after 2015. The current usage metrics is available 48-96 hours after online publication and is updated daily on week days.
Initial download of the metrics may take a while.