Free Access
Fig. 8
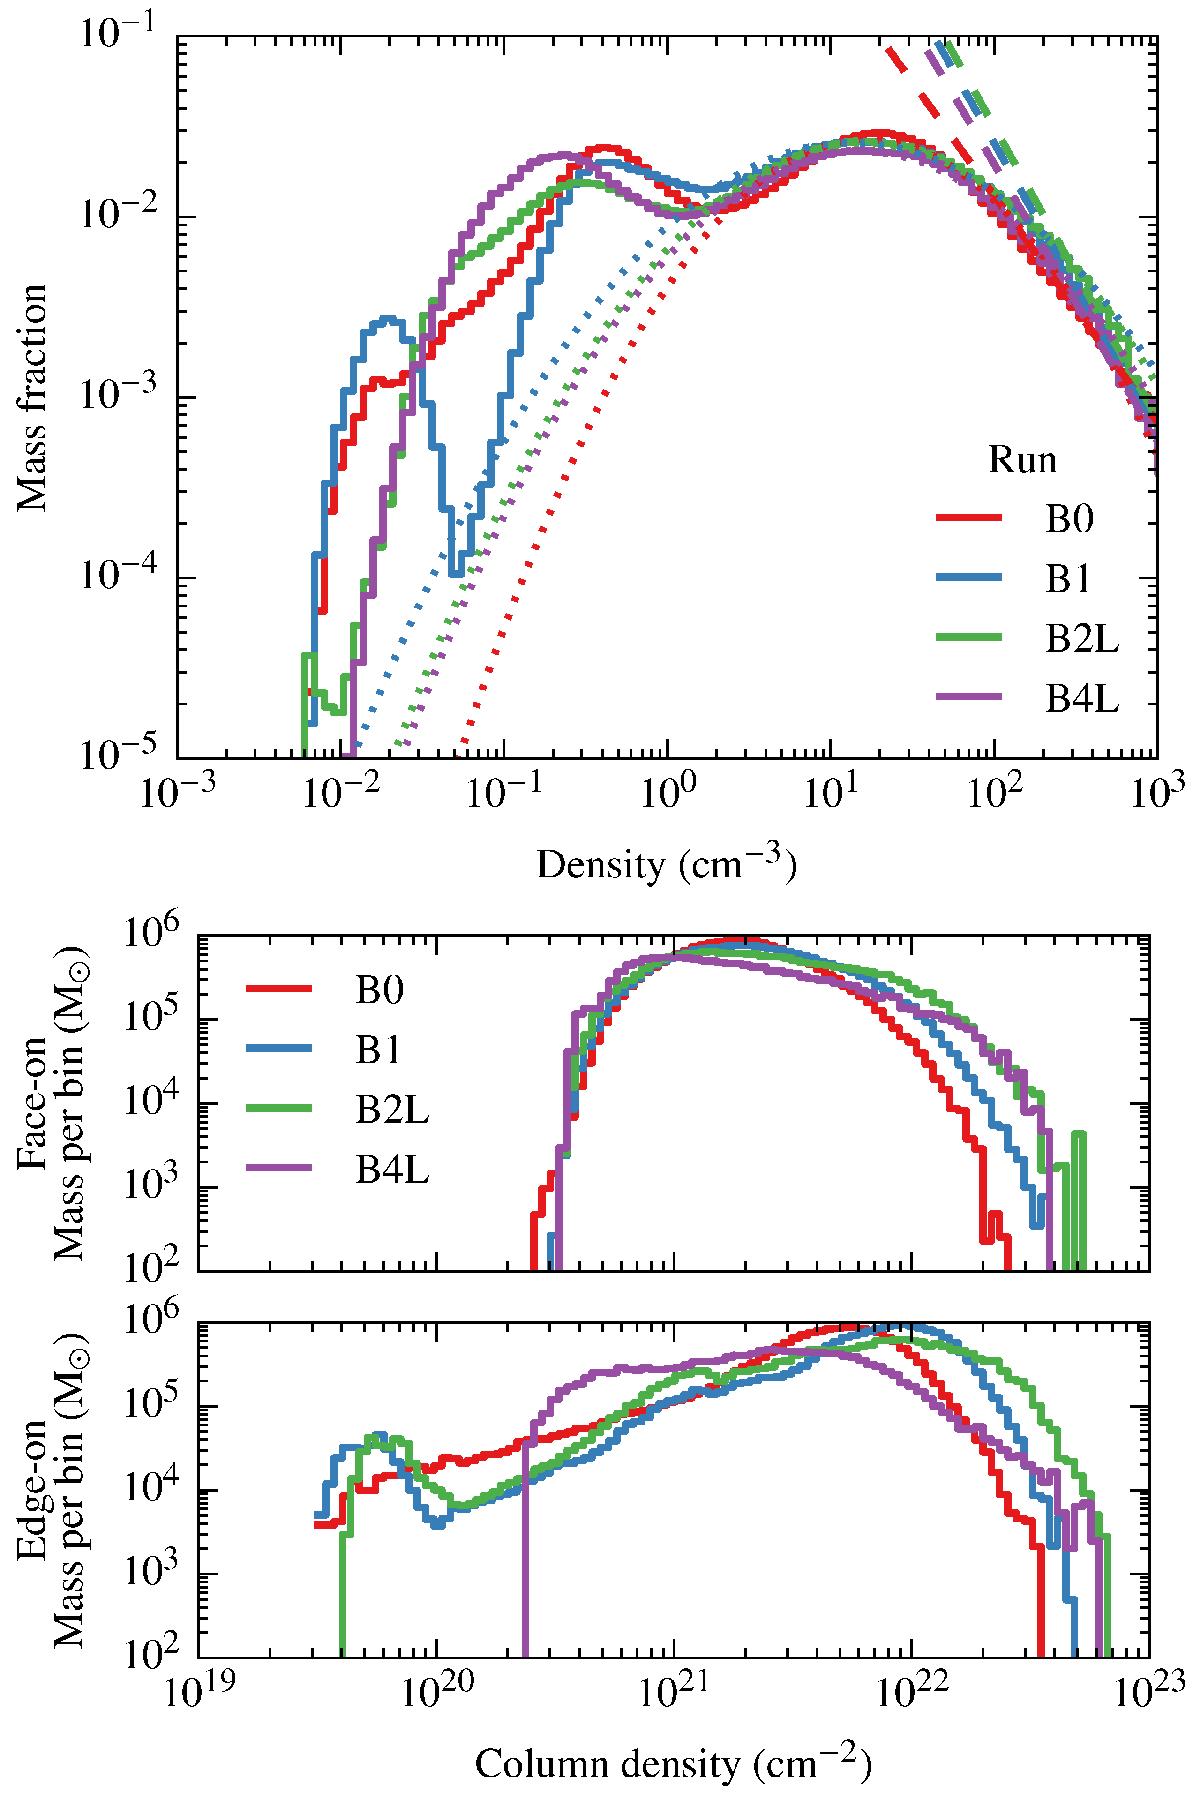
Density (upper panel) and column density (lower panels) distributions for the runs with strong feedback. The dotted parabolas are log-normal fits between 1 and 100 cm-3 and the dashed lines are tentative power-law fits above 100 cm-3, with slopes −1.1, −1.5, −1.6, and −1.5 for runs B0L, B1L, B2L, and B4L respectively.
This figure is made of several images, please see below:
Current usage metrics show cumulative count of Article Views (full-text article views including HTML views, PDF and ePub downloads, according to the available data) and Abstracts Views on Vision4Press platform.
Data correspond to usage on the plateform after 2015. The current usage metrics is available 48-96 hours after online publication and is updated daily on week days.
Initial download of the metrics may take a while.