Fig. 7
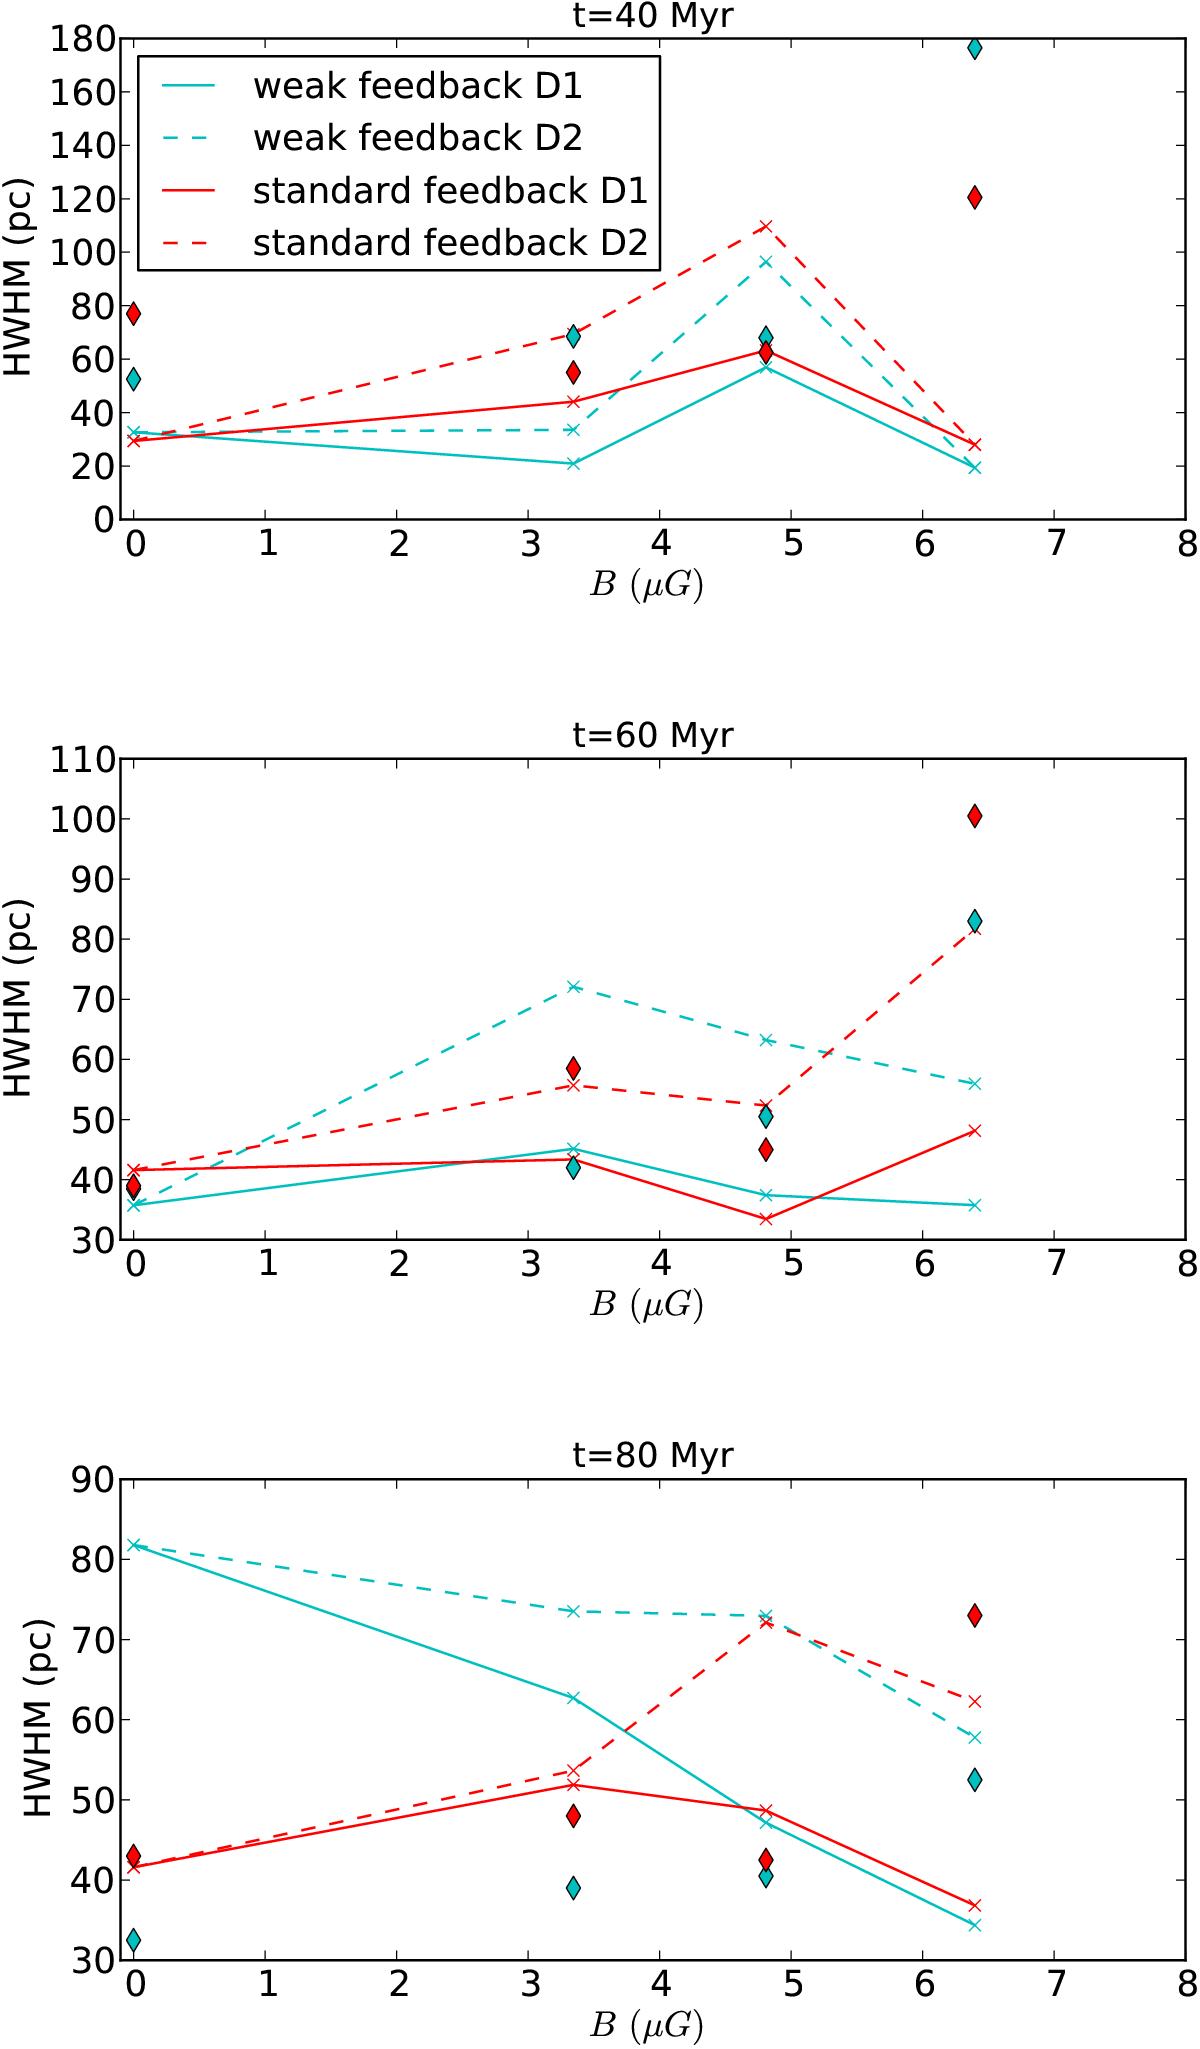
Comparison between the half width at half maximum (HWHM) of the density profiles measured in the simulations (diamonds) and the analytical models at time 40, 60 and 80 Myr. Red lines represent the standard feedback case and cyan ones the weak feedback case. Solid lines stand for constant dissipation while dashed ones represent magnetically dependent dissipation (see text).
Current usage metrics show cumulative count of Article Views (full-text article views including HTML views, PDF and ePub downloads, according to the available data) and Abstracts Views on Vision4Press platform.
Data correspond to usage on the plateform after 2015. The current usage metrics is available 48-96 hours after online publication and is updated daily on week days.
Initial download of the metrics may take a while.