Fig. 7
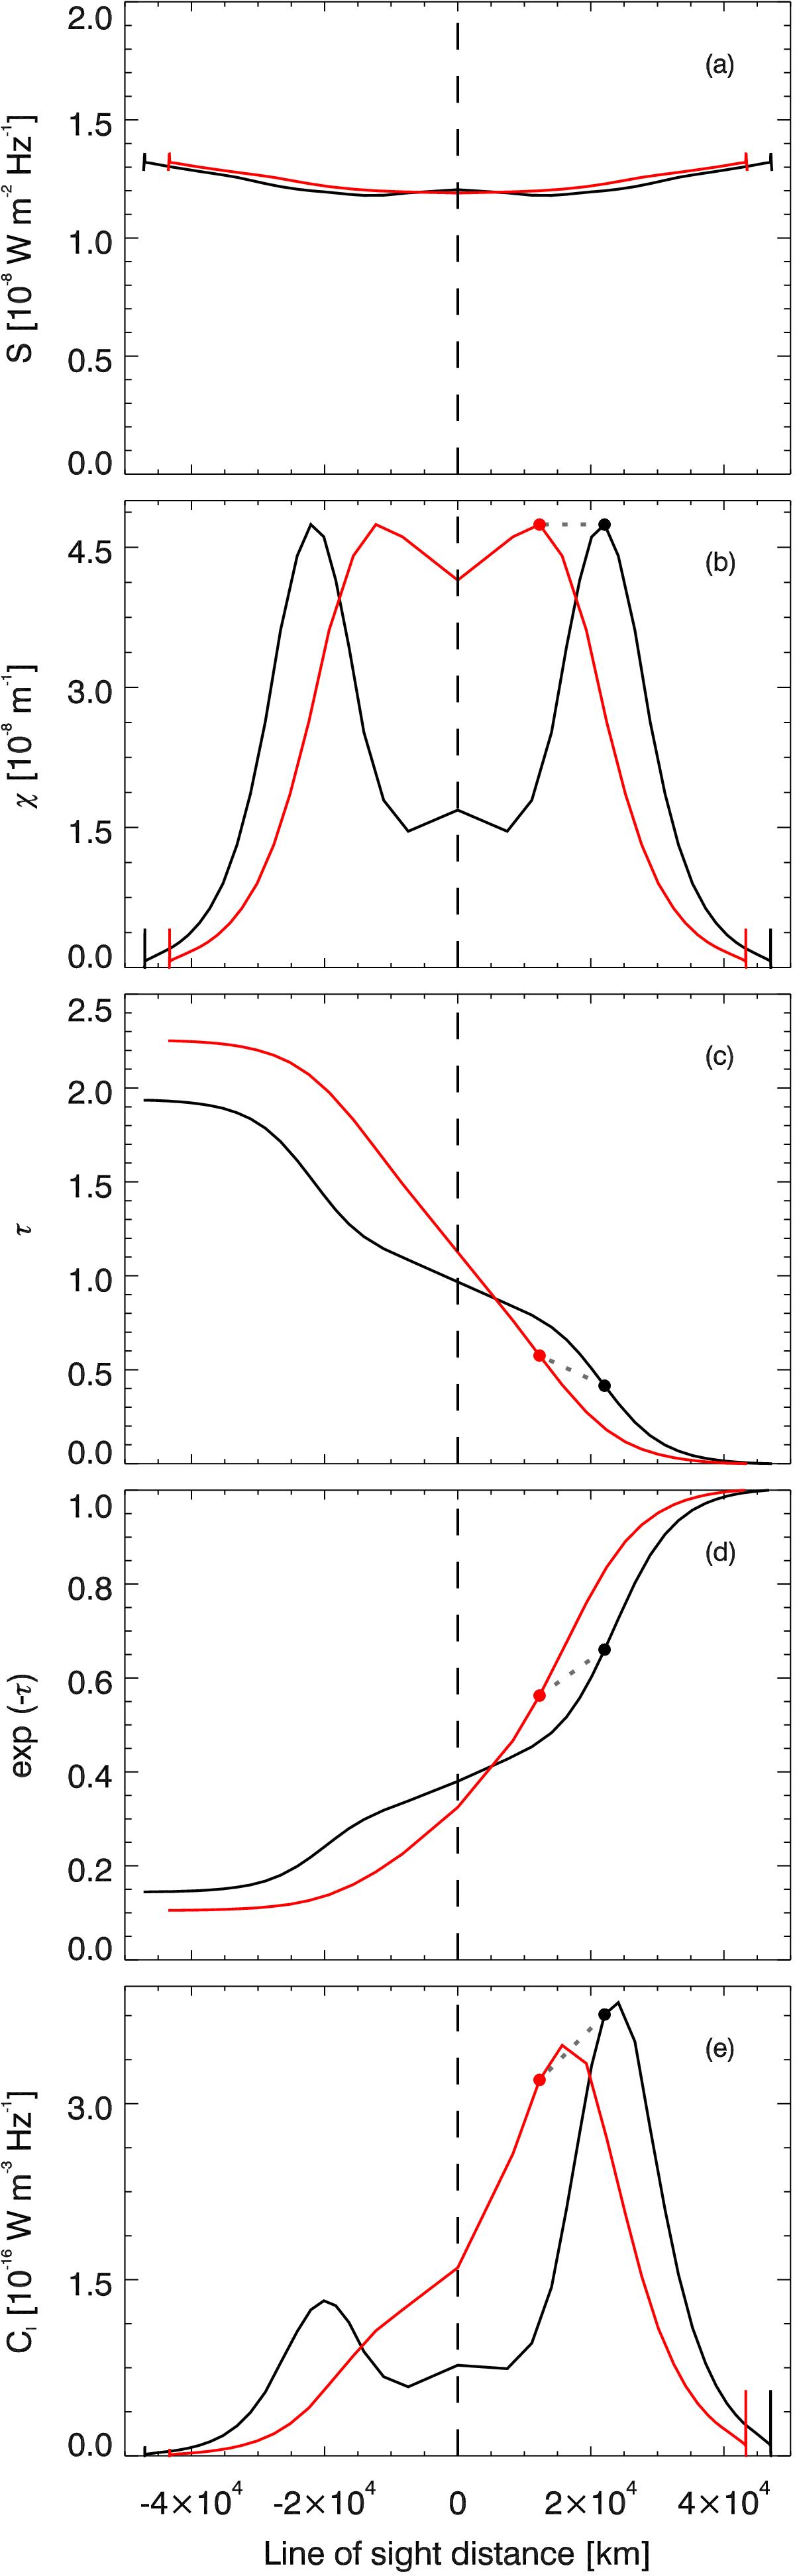
Formation of the dark gap. The black curves show values for a ray that gives rise to the dark gap while the red curve represents the maximum off-limb emission. Panels, from top to bottom: source function, extinction coefficient, radial optical depth τ, e− τ, and the contribution function CI, all as functions of geometrical length along the ray. The dashed lines connect points with the same geometric vertical height in the atmosphere.
Current usage metrics show cumulative count of Article Views (full-text article views including HTML views, PDF and ePub downloads, according to the available data) and Abstracts Views on Vision4Press platform.
Data correspond to usage on the plateform after 2015. The current usage metrics is available 48-96 hours after online publication and is updated daily on week days.
Initial download of the metrics may take a while.