Fig. 3
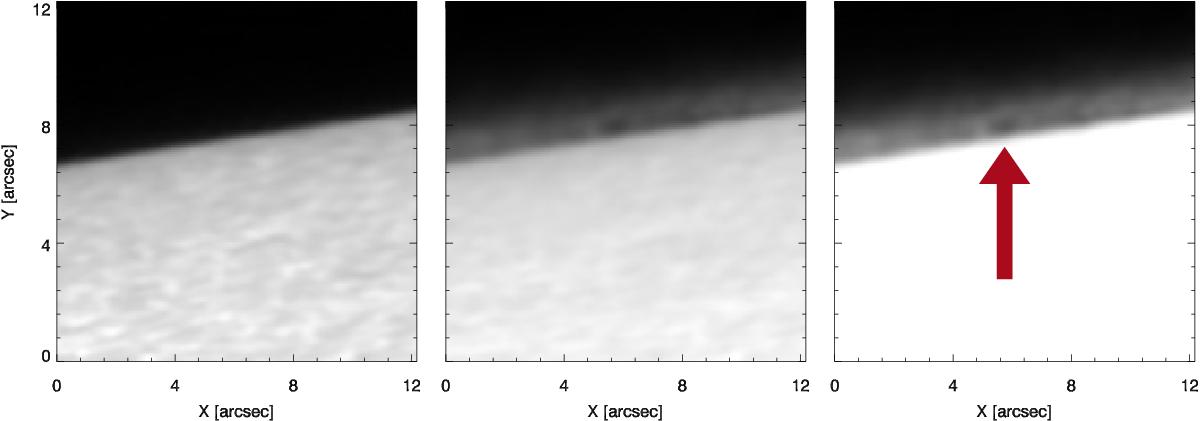
Quiet solar limb imaged in the continuum close to O i 7772 Å line and in its line core. Left panel: continuum image (810 mÅ from the line core). Centre panel: line core image. Right panel: line core image with intensity scaling to better show the off-limb emission. These images have not undergone any radial enhancement as in Fig. 2. The red arrow indicates a point on the limb where the dark gap is strong and where the radial intensity profile used to compare with modelling is extracted.
Current usage metrics show cumulative count of Article Views (full-text article views including HTML views, PDF and ePub downloads, according to the available data) and Abstracts Views on Vision4Press platform.
Data correspond to usage on the plateform after 2015. The current usage metrics is available 48-96 hours after online publication and is updated daily on week days.
Initial download of the metrics may take a while.