Free Access
Fig. 10
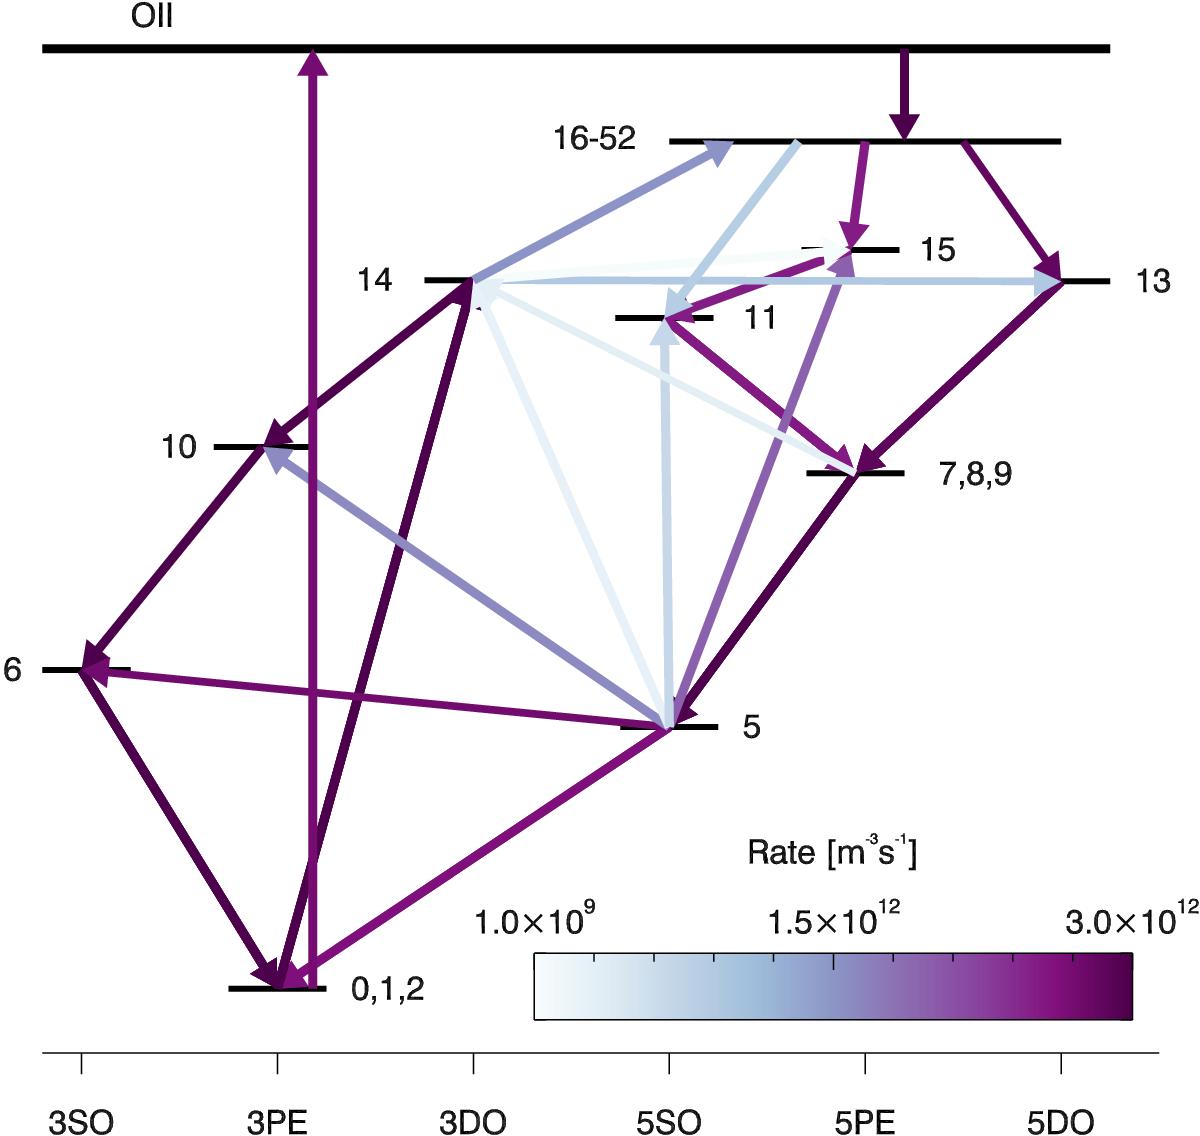
Net rates visualised in the term diagram for the maximum off-limb opacity height. The colours of the arrows indicate the logarithm of the absolute value of the net rate with light blue the lowest rates and dark purple the highest net rates.
Current usage metrics show cumulative count of Article Views (full-text article views including HTML views, PDF and ePub downloads, according to the available data) and Abstracts Views on Vision4Press platform.
Data correspond to usage on the plateform after 2015. The current usage metrics is available 48-96 hours after online publication and is updated daily on week days.
Initial download of the metrics may take a while.