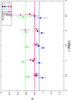
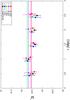
Fig. 9

Evolution of the stacked Subaru/F814W cluster GLF in disks of increasing radius. Top: shows the variation of the α parameter and bottom the variation of the M∗ parameter. Every GLF from the stacks is computed in a disk centered on the cluster center and extending to the radius displayed on the figure. Black dots correspond to parameters derived from the stack of all clusters, blue dots to low-redshift clusters (0.19 <z< 0.39), green dots to high-redshift clusters (0.40 <z< 0.69), magenta dots to low-mass clusters (6 × 10¹⁴M⊙<M200< 1015M⊙), and red dots to high-mass clusters (1015M⊙<M200). The horizontal lines correspond to the values measured from Figs. 6 and 7. Dots are slightly shifted around their values on the x-axis for clarity.
Current usage metrics show cumulative count of Article Views (full-text article views including HTML views, PDF and ePub downloads, according to the available data) and Abstracts Views on Vision4Press platform.
Data correspond to usage on the plateform after 2015. The current usage metrics is available 48-96 hours after online publication and is updated daily on week days.
Initial download of the metrics may take a while.