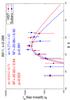
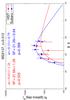
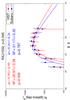
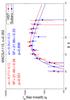
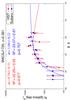
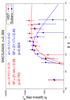
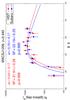
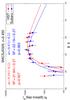
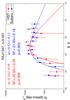
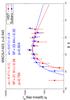
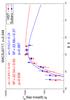
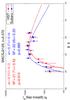
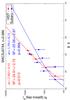
Fig. 4
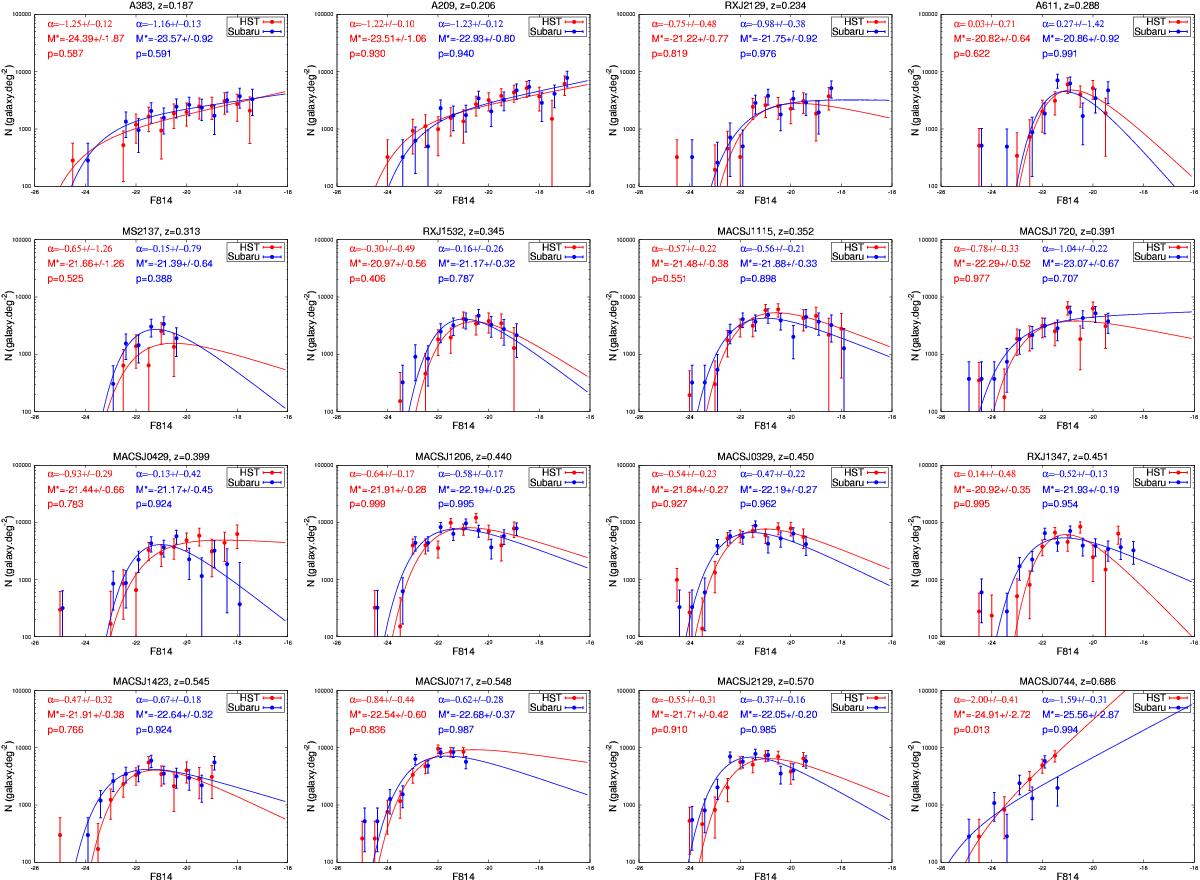
Individual cluster GLFs in the F814W filter, sorted from low to high redshift. Red and blue correspond to the GLFs measured with HST and Subaru, respectively. The curves are the Schechter fits to the data up to the 90% completeness magnitude limit. The parameters from each fit are displayed in the corresponding color: the slope α, the characteristic magnitude M∗, and the significance of the fit p defined in Eq. (2). Each GLF is computed within a circle centered on the cluster center with the largest possible radius given the HST field of view, and is normalized to one square degree.
Current usage metrics show cumulative count of Article Views (full-text article views including HTML views, PDF and ePub downloads, according to the available data) and Abstracts Views on Vision4Press platform.
Data correspond to usage on the plateform after 2015. The current usage metrics is available 48-96 hours after online publication and is updated daily on week days.
Initial download of the metrics may take a while.