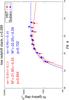
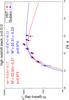
Fig. 10

Effect of SB dimming when evolving the low-redshift sample to high redshift. Top: represents the low-redshift simulated stack GLF (![]() ) and bottom the GLF of the same clusters simulated at high redshift (
) and bottom the GLF of the same clusters simulated at high redshift (![]() ). Red and blue correspond to the GLFs measured with HST and Subaru, respectively, which are normalized to one square degree. The curves correspond to the Schechter fits to the data. The parameters from each fit are displayed in the corresponding color.
). Red and blue correspond to the GLFs measured with HST and Subaru, respectively, which are normalized to one square degree. The curves correspond to the Schechter fits to the data. The parameters from each fit are displayed in the corresponding color.
Current usage metrics show cumulative count of Article Views (full-text article views including HTML views, PDF and ePub downloads, according to the available data) and Abstracts Views on Vision4Press platform.
Data correspond to usage on the plateform after 2015. The current usage metrics is available 48-96 hours after online publication and is updated daily on week days.
Initial download of the metrics may take a while.