Fig. 1
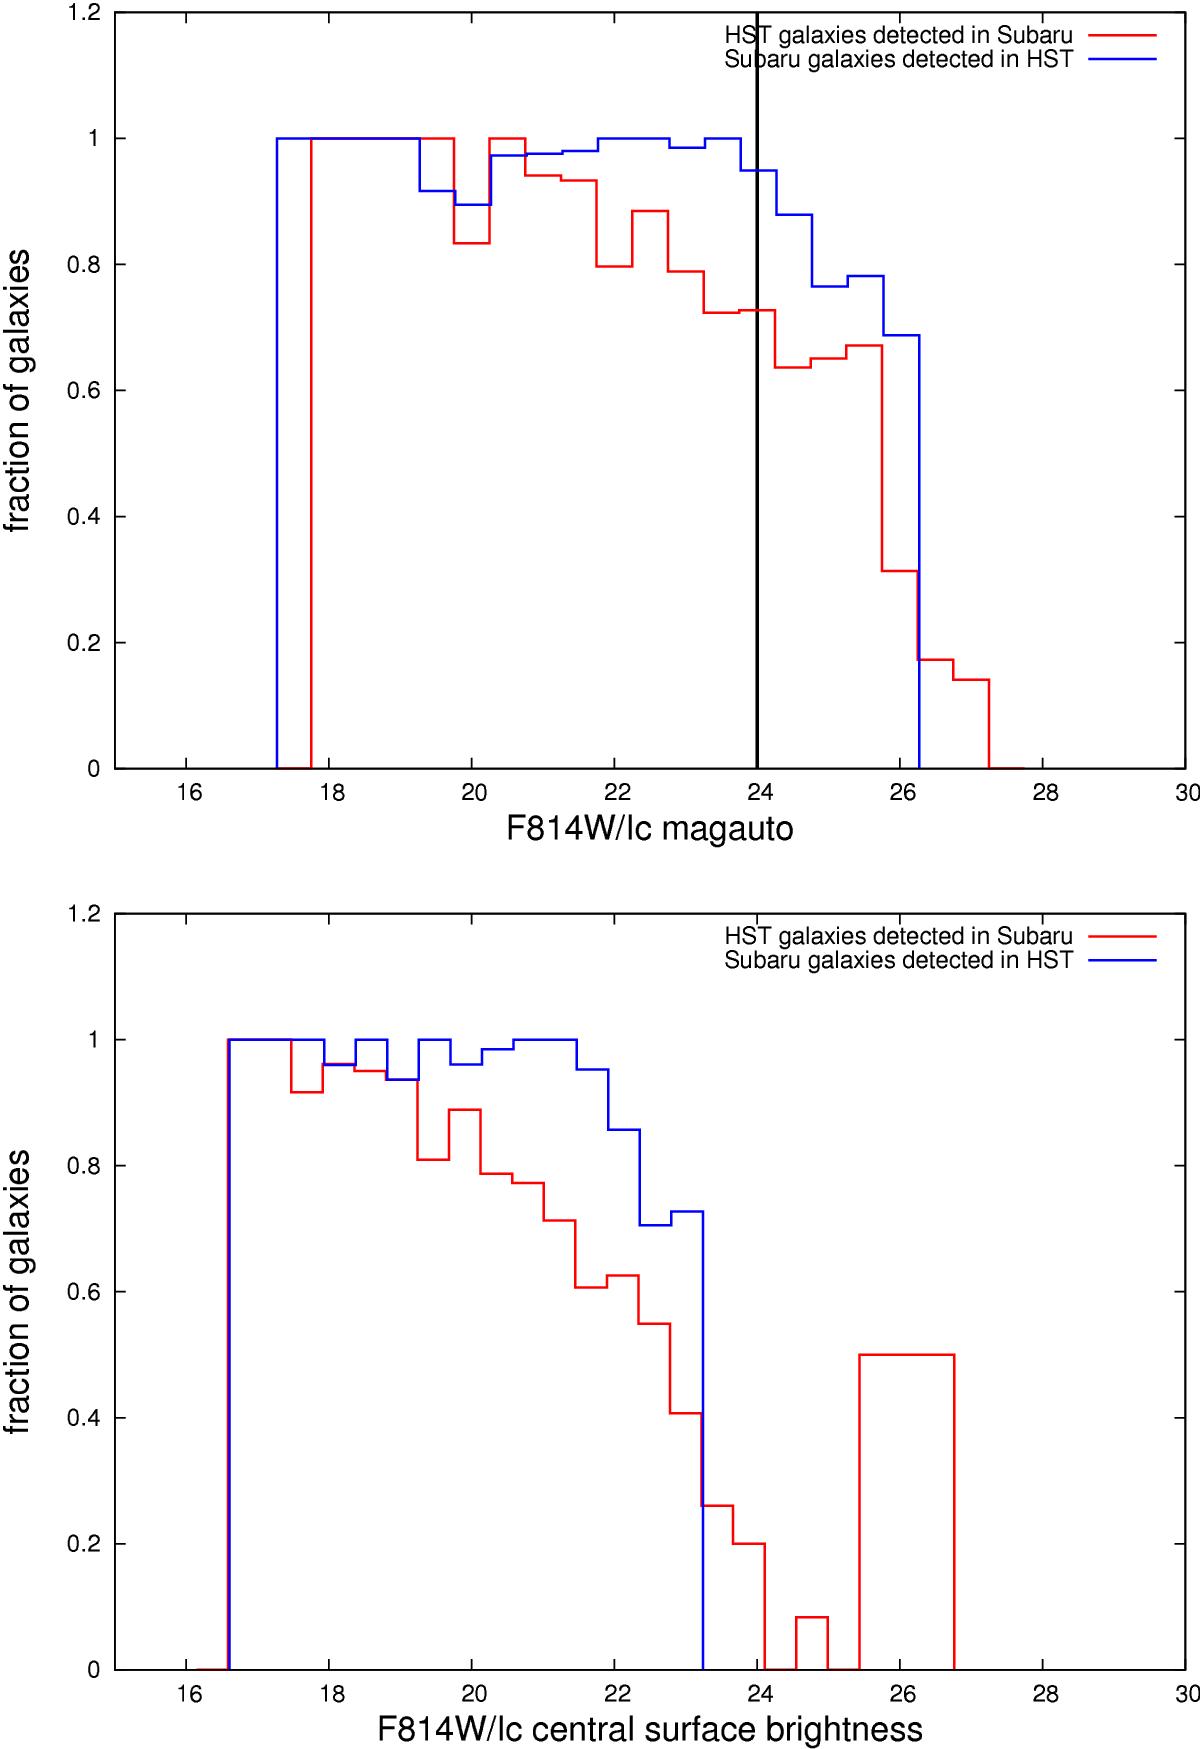
Fraction of galaxies detected in one instrument that are redetected in the other one, as a function of magnitude (top) and central SB (bottom), for cluster RX J1347. The red histogram corresponds to the fraction of HST galaxies redetected in the Subaru image and the blue one to the fraction of Subaru galaxies that are redetected in the HST image. The black vertical line indicates the 90% Subaru completeness magnitude limit.

Current usage metrics show cumulative count of Article Views (full-text article views including HTML views, PDF and ePub downloads, according to the available data) and Abstracts Views on Vision4Press platform.
Data correspond to usage on the plateform after 2015. The current usage metrics is available 48-96 hours after online publication and is updated daily on week days.
Initial download of the metrics may take a while.