Fig. 8
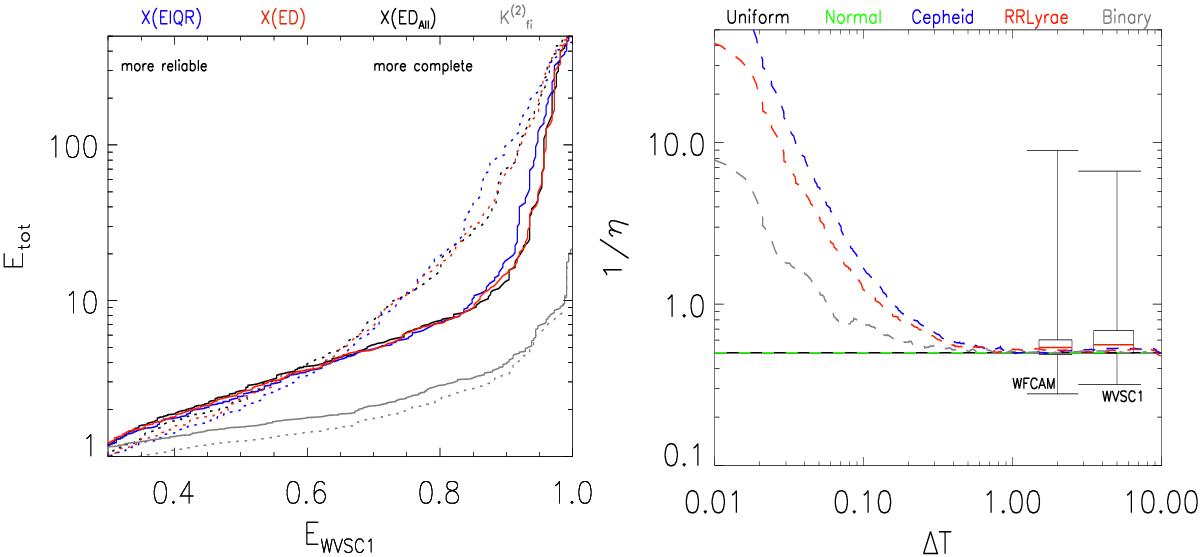
Etot vs. EWVSC1 (left panel) for the best selection criteria and 1 /η as a function of time interval mean among the measurements ΔT (right panel). In the left panel, the statistical parameters X(EIQR) (blue lines), X(Dσμ) (red lines), and X(ED) (dark lines) for ZYJHK (full lines) and K (dashed lines) wavebands, respectively. In the same diagram the results found for ![]() using the mean (full grey line) and even-mean (dashed grey line), respectively, are also plotted. The results for normal, uniform, Ceph, RR, and EB simulated distributions are shown in the right panel. The colours indicate different parameters or distributions analyzed, which are indicated at the top of each diagram. In the right panel we show how 1 /η varies with the selection of ΔT. The box plot indicates the quartiles of WFCAM and WVSC1 samples, where each box encloses 50% of the sample under the grouping algorithm that defines ΔT in Sokolovsky et al. (2017).
using the mean (full grey line) and even-mean (dashed grey line), respectively, are also plotted. The results for normal, uniform, Ceph, RR, and EB simulated distributions are shown in the right panel. The colours indicate different parameters or distributions analyzed, which are indicated at the top of each diagram. In the right panel we show how 1 /η varies with the selection of ΔT. The box plot indicates the quartiles of WFCAM and WVSC1 samples, where each box encloses 50% of the sample under the grouping algorithm that defines ΔT in Sokolovsky et al. (2017).
Current usage metrics show cumulative count of Article Views (full-text article views including HTML views, PDF and ePub downloads, according to the available data) and Abstracts Views on Vision4Press platform.
Data correspond to usage on the plateform after 2015. The current usage metrics is available 48-96 hours after online publication and is updated daily on week days.
Initial download of the metrics may take a while.