Fig. 7
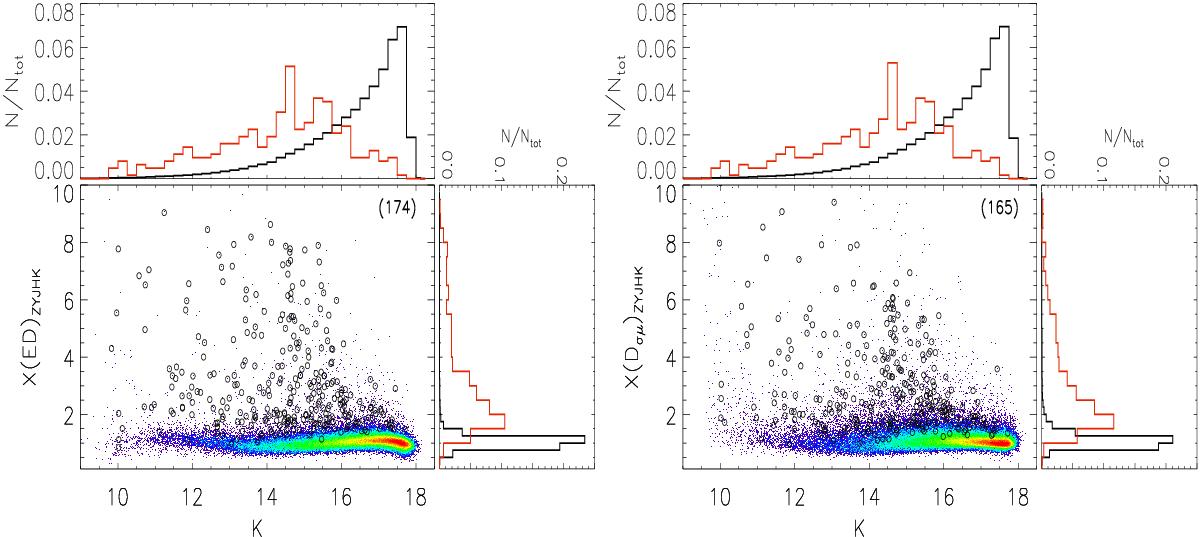
X indices using all wavebands XZYJHK for ED and Dσμ. The X(ED) index was computed using the Strateva function without sample size correction for BA photometry, while X(ED) was computed using the Strateva modified function with sample size correction for the BAS approach. The histograms of the entire sample (black lines) and WVSC1 stars (red lines) are shown at the top right. The WVSC1 stars are also represented by open black circles and the maximum number of sources per pixel is shown in brackets.
Current usage metrics show cumulative count of Article Views (full-text article views including HTML views, PDF and ePub downloads, according to the available data) and Abstracts Views on Vision4Press platform.
Data correspond to usage on the plateform after 2015. The current usage metrics is available 48-96 hours after online publication and is updated daily on week days.
Initial download of the metrics may take a while.