Fig. 6
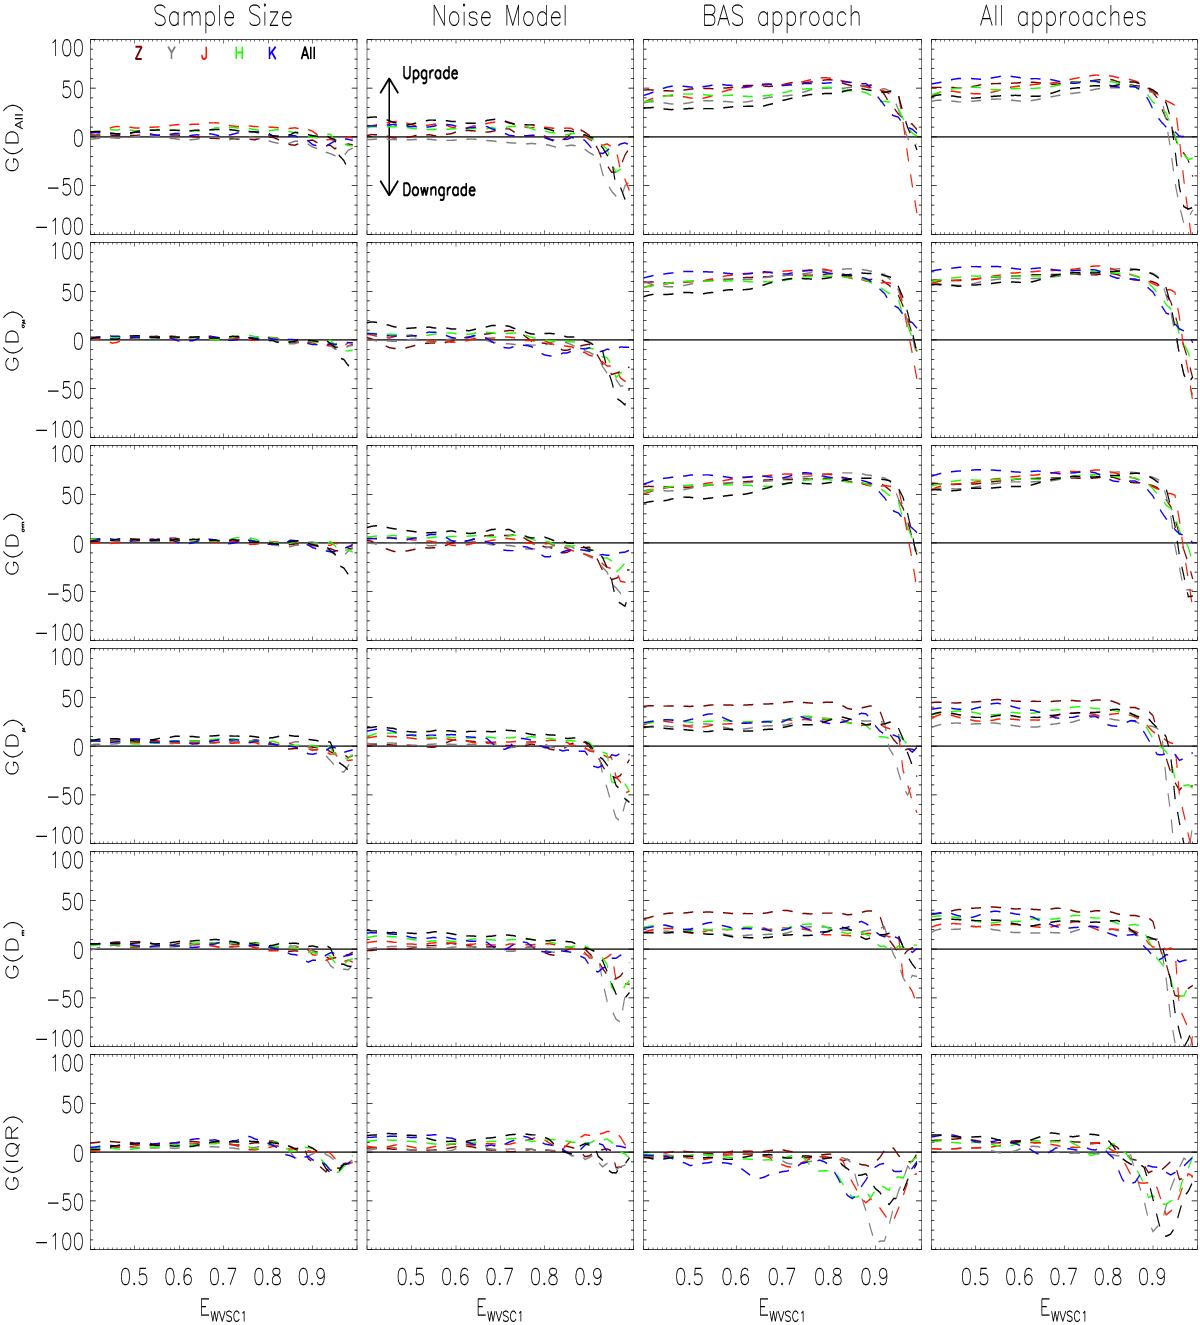
G vs. EWVSC1 using different approaches (see Sect. 7.4). The approach used is named above in each of the upper diagrams. The colours indicate the results for different filters ZYJHK (brown, grey, red, green, and blue lines respectively) and the combination of results found in all bands (black lines). The same colours were also used in Fig. 5 (bottom panel).
Current usage metrics show cumulative count of Article Views (full-text article views including HTML views, PDF and ePub downloads, according to the available data) and Abstracts Views on Vision4Press platform.
Data correspond to usage on the plateform after 2015. The current usage metrics is available 48-96 hours after online publication and is updated daily on week days.
Initial download of the metrics may take a while.