Free Access
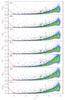
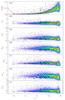
Fig. 4
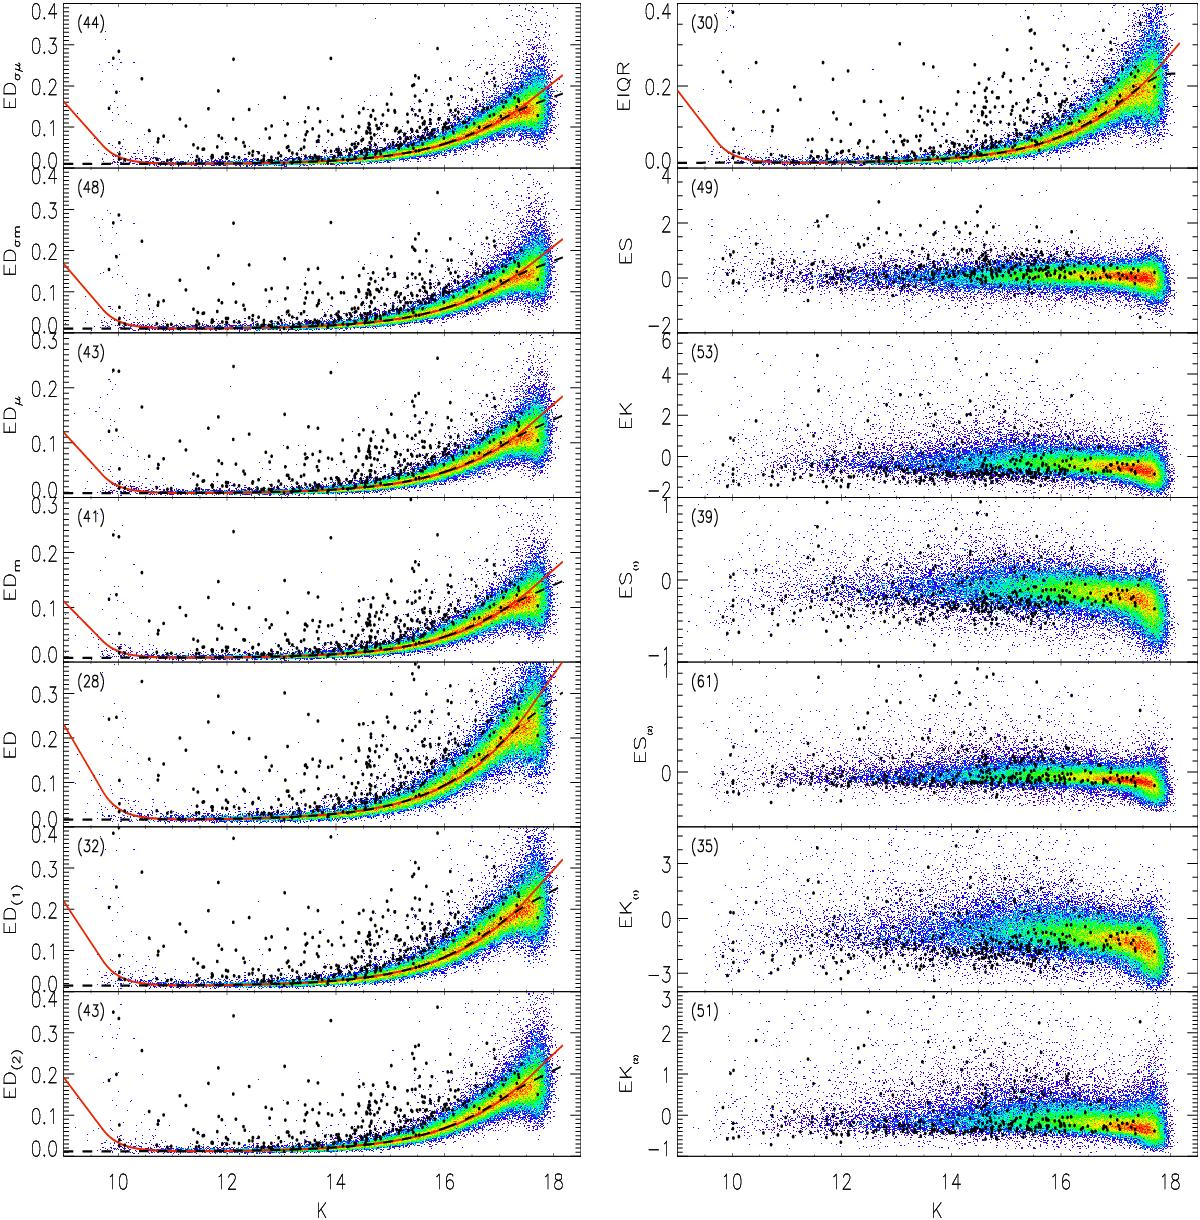
Dispersion and shape parameters as a function of magnitude where the black dots indicate the WVSC1 stars. The red and dashed black lines indicate the Strateva-modified and Strateva functions, respectively. The maximum number of sources per pixel is shown in brackets in each panel.
This figure is made of several images, please see below:
Current usage metrics show cumulative count of Article Views (full-text article views including HTML views, PDF and ePub downloads, according to the available data) and Abstracts Views on Vision4Press platform.
Data correspond to usage on the plateform after 2015. The current usage metrics is available 48-96 hours after online publication and is updated daily on week days.
Initial download of the metrics may take a while.