Fig. 11
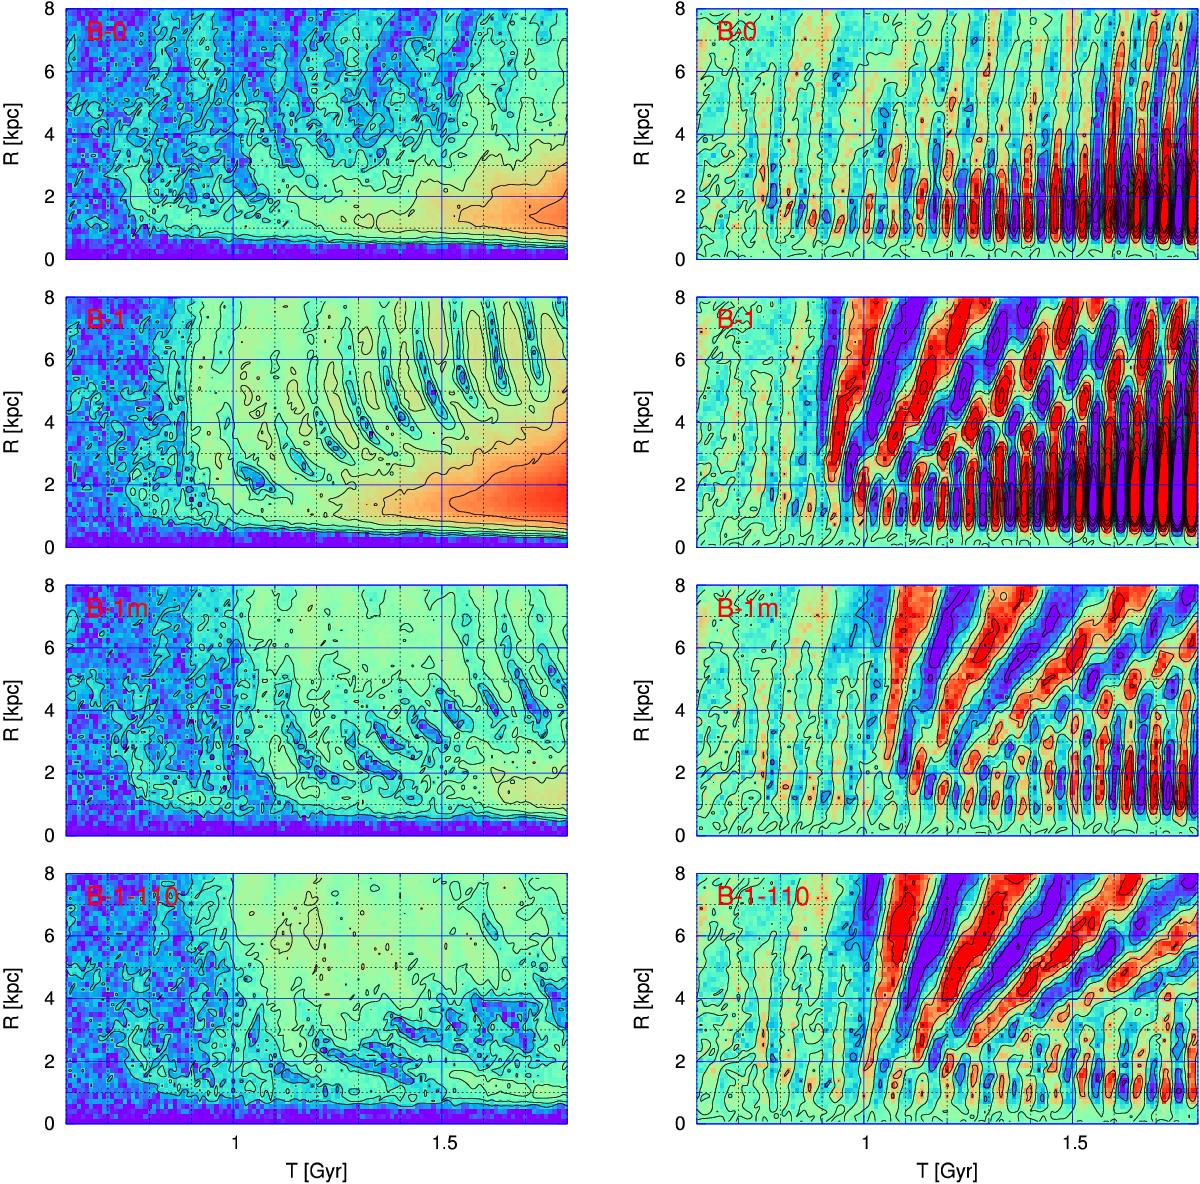
Surface density maps log | A2/A0 | (left panels, red = high, blue = low amplitude); Re A2/A0 (right panels, red = positive, blue = negative amplitude at the x-axis) for B-0, B-1, B-1m, and B-1-110 runs (top to bottom), reflecting the interference between the bar-like perturbation in the centre, random perturbations, and tidally induced waves. The time period is 0.6 <t< 1.8 Gyr.
Current usage metrics show cumulative count of Article Views (full-text article views including HTML views, PDF and ePub downloads, according to the available data) and Abstracts Views on Vision4Press platform.
Data correspond to usage on the plateform after 2015. The current usage metrics is available 48-96 hours after online publication and is updated daily on week days.
Initial download of the metrics may take a while.