Fig. B.1
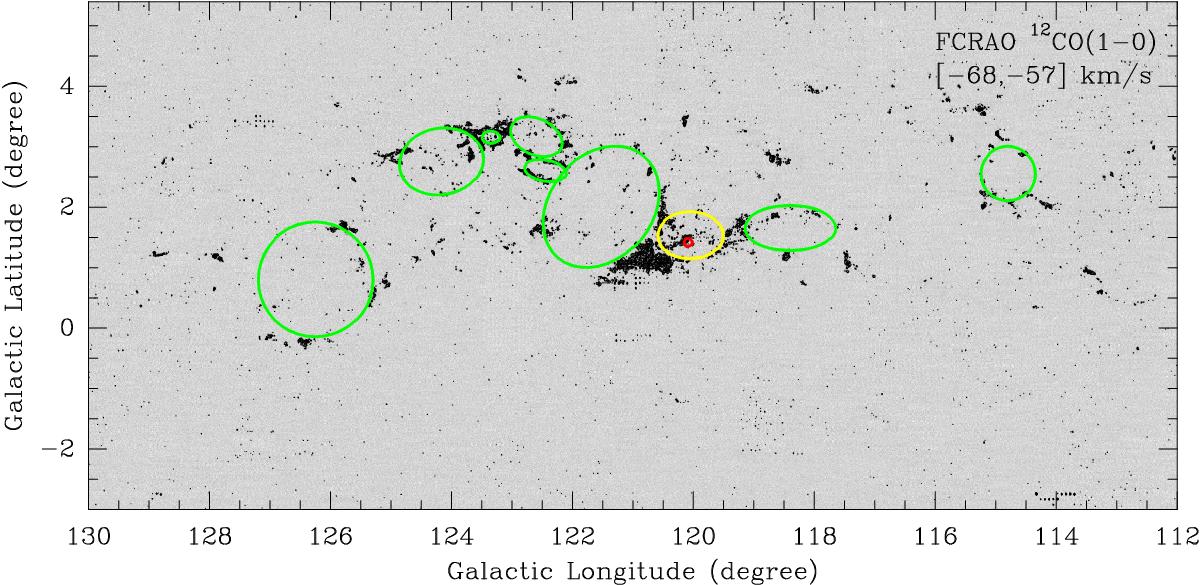
Larger-field FCRAO 12CO (1–0) intensity image around Tycho’s SNR, integrated between −68 and −57 km s-1 (as same as Fig. 1). The contours start at 3σ and then increase in steps of 2σ (1σ ~ 1.7 K km s-1). The red circle shows the shell-like structure in Tycho’s SNR, while the yellow ellipse shows the cavity found in the MWISP CO images. The green ellipses show similar cavity-like structures found in the FCRAO CO image.
Current usage metrics show cumulative count of Article Views (full-text article views including HTML views, PDF and ePub downloads, according to the available data) and Abstracts Views on Vision4Press platform.
Data correspond to usage on the plateform after 2015. The current usage metrics is available 48-96 hours after online publication and is updated daily on week days.
Initial download of the metrics may take a while.