Fig. 6
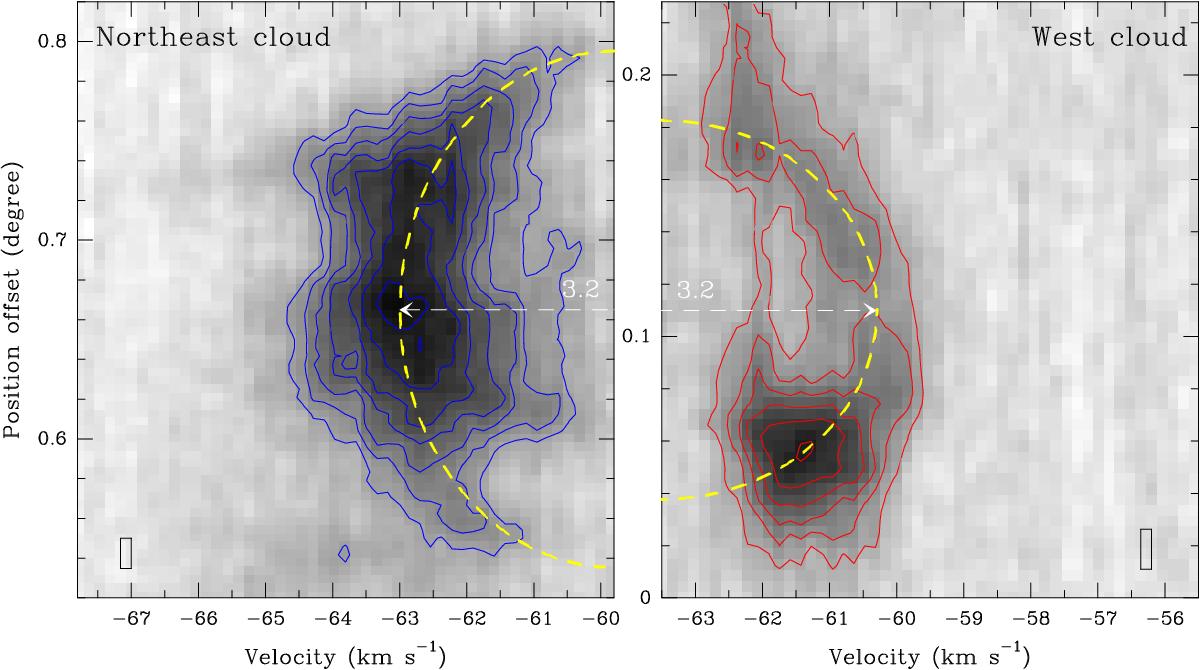
A comparison between the position-velocity diagrams of the northeast cloud (from Fig. 5b, but contours start at 1.5 K and then increase in steps of 0.5 K, where 1σ is ~0.15 K) and the west cloud (from Fig. 5d, but contours start at 1.0 K and then increase in steps of 0.5 K, where 1σ is ~0.16 K). Both diagrams could be fitted with an ellipse (yellow dashed curve) with a velocity radius of ~3.2 km s-1. The small rectangle in each panel shows the angular and velocity resolutions in the MWISP 12CO observations.
Current usage metrics show cumulative count of Article Views (full-text article views including HTML views, PDF and ePub downloads, according to the available data) and Abstracts Views on Vision4Press platform.
Data correspond to usage on the plateform after 2015. The current usage metrics is available 48-96 hours after online publication and is updated daily on week days.
Initial download of the metrics may take a while.