Fig. 5
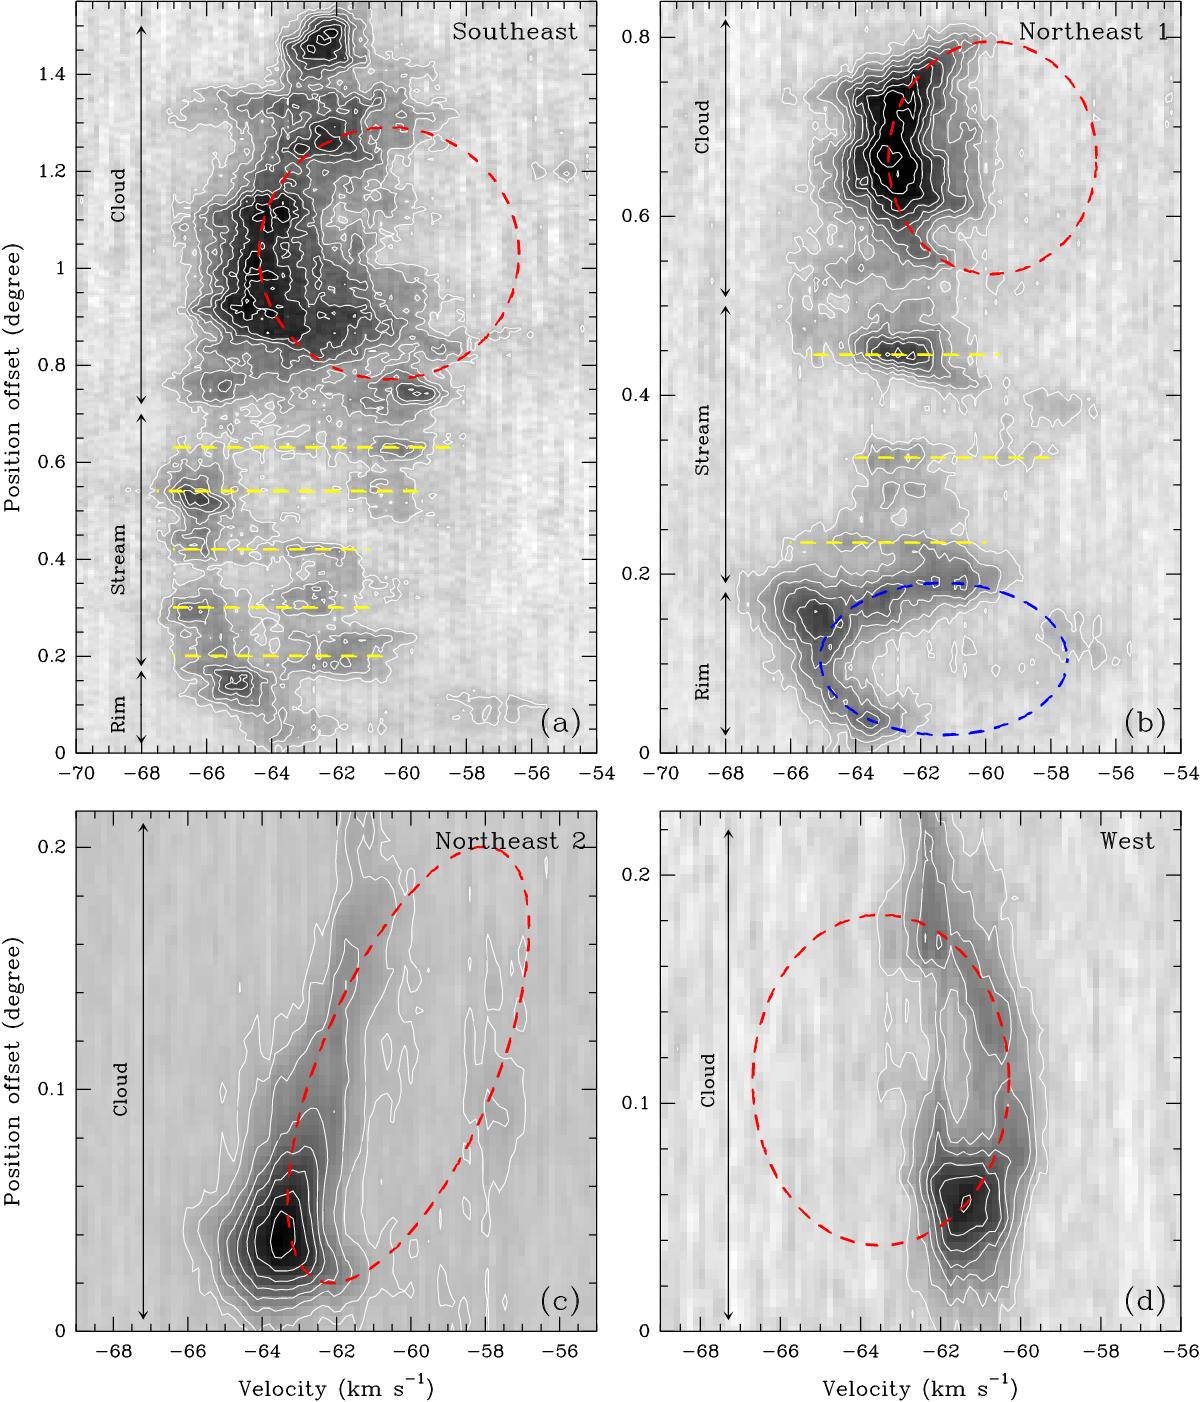
Position-velocity diagrams along the four routes shown in Fig. 4. a) The contours start at 0.6 K and increase in steps of 0.5 K (1σ ~ 0.15–0.16 K). The red ellipse (with a velocity radius of ~4 km s-1) shows a fitting toward the curve-shaped morphology seen in the southeast cloud (suggesting gas expansion), while the yellow lines show the velocity broadenings seen in the stream-like structure (suggesting shocked emission). b) The contours start at 0.5 K and increase in steps of 0.5 K (1σ ~ 0.15 K). The red ellipse (velocity radius of ~3.2 km s-1) and blue ellipse (velocity radius of ~3.8 km s-1) show the fitting toward the curve-shaped morphologies seen in the northeast cloud and inner rim, respectively. c) The contours start at 0.5 K and 1.0 K, and then increase in steps of 1.0 K (1σ ~ 0.15 K). The velocity radius of the red ellipse is ~3.3 km s-1. d) The contours start at 0.5 K and increase in steps of 0.5 K (1σ ~ 0.16 K). The velocity radius of the red ellipse is ~3.2 km s-1.
Current usage metrics show cumulative count of Article Views (full-text article views including HTML views, PDF and ePub downloads, according to the available data) and Abstracts Views on Vision4Press platform.
Data correspond to usage on the plateform after 2015. The current usage metrics is available 48-96 hours after online publication and is updated daily on week days.
Initial download of the metrics may take a while.