Fig. 4
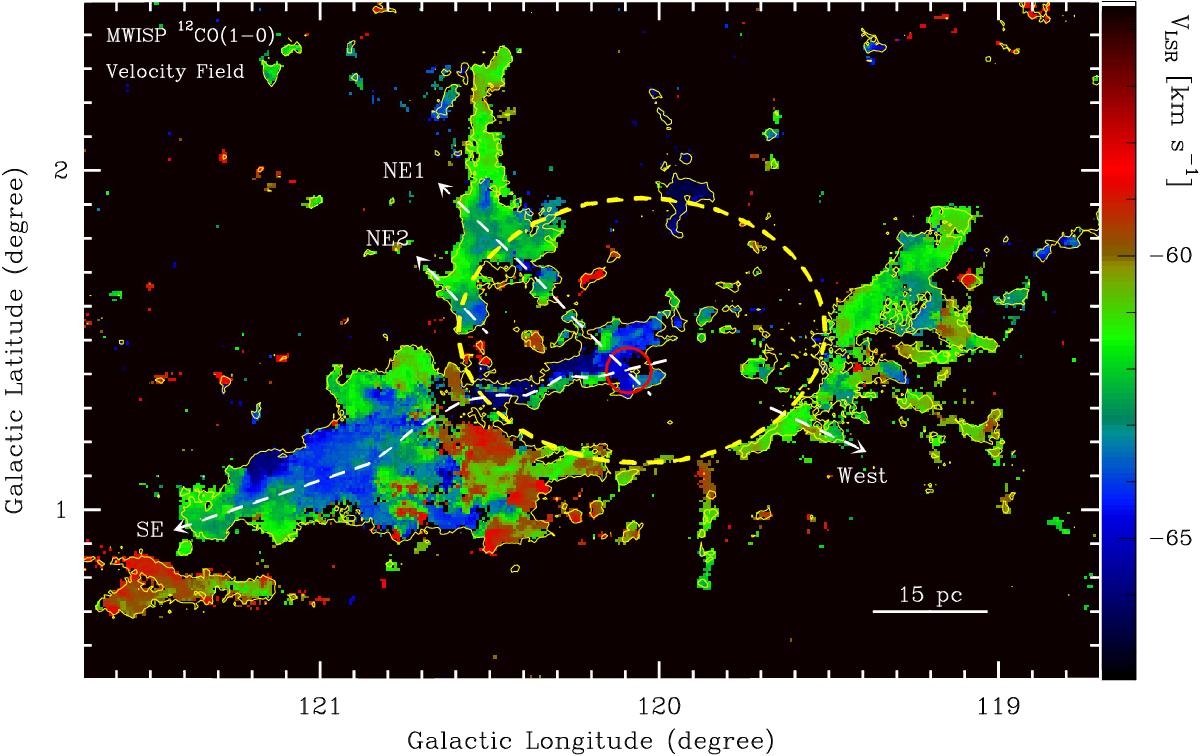
Velocity field of the MWISP 12CO (1–0) emission (1st moment; color scale). The emission is integrated between −68 and −57 km s-1. The yellow contour shows the intensity emission at the 5σ level (1σ~ 0.8 K km s-1). The yellow dashed ellipse shows the cavity found in the 12CO image, while the red circle shows the position and size of the shell-like structure found in Tycho’s SNR. The four white dashed arrow lines show the routes of the position-velocity diagrams shown in Fig. 5.
Current usage metrics show cumulative count of Article Views (full-text article views including HTML views, PDF and ePub downloads, according to the available data) and Abstracts Views on Vision4Press platform.
Data correspond to usage on the plateform after 2015. The current usage metrics is available 48-96 hours after online publication and is updated daily on week days.
Initial download of the metrics may take a while.