Free Access
Fig. 8
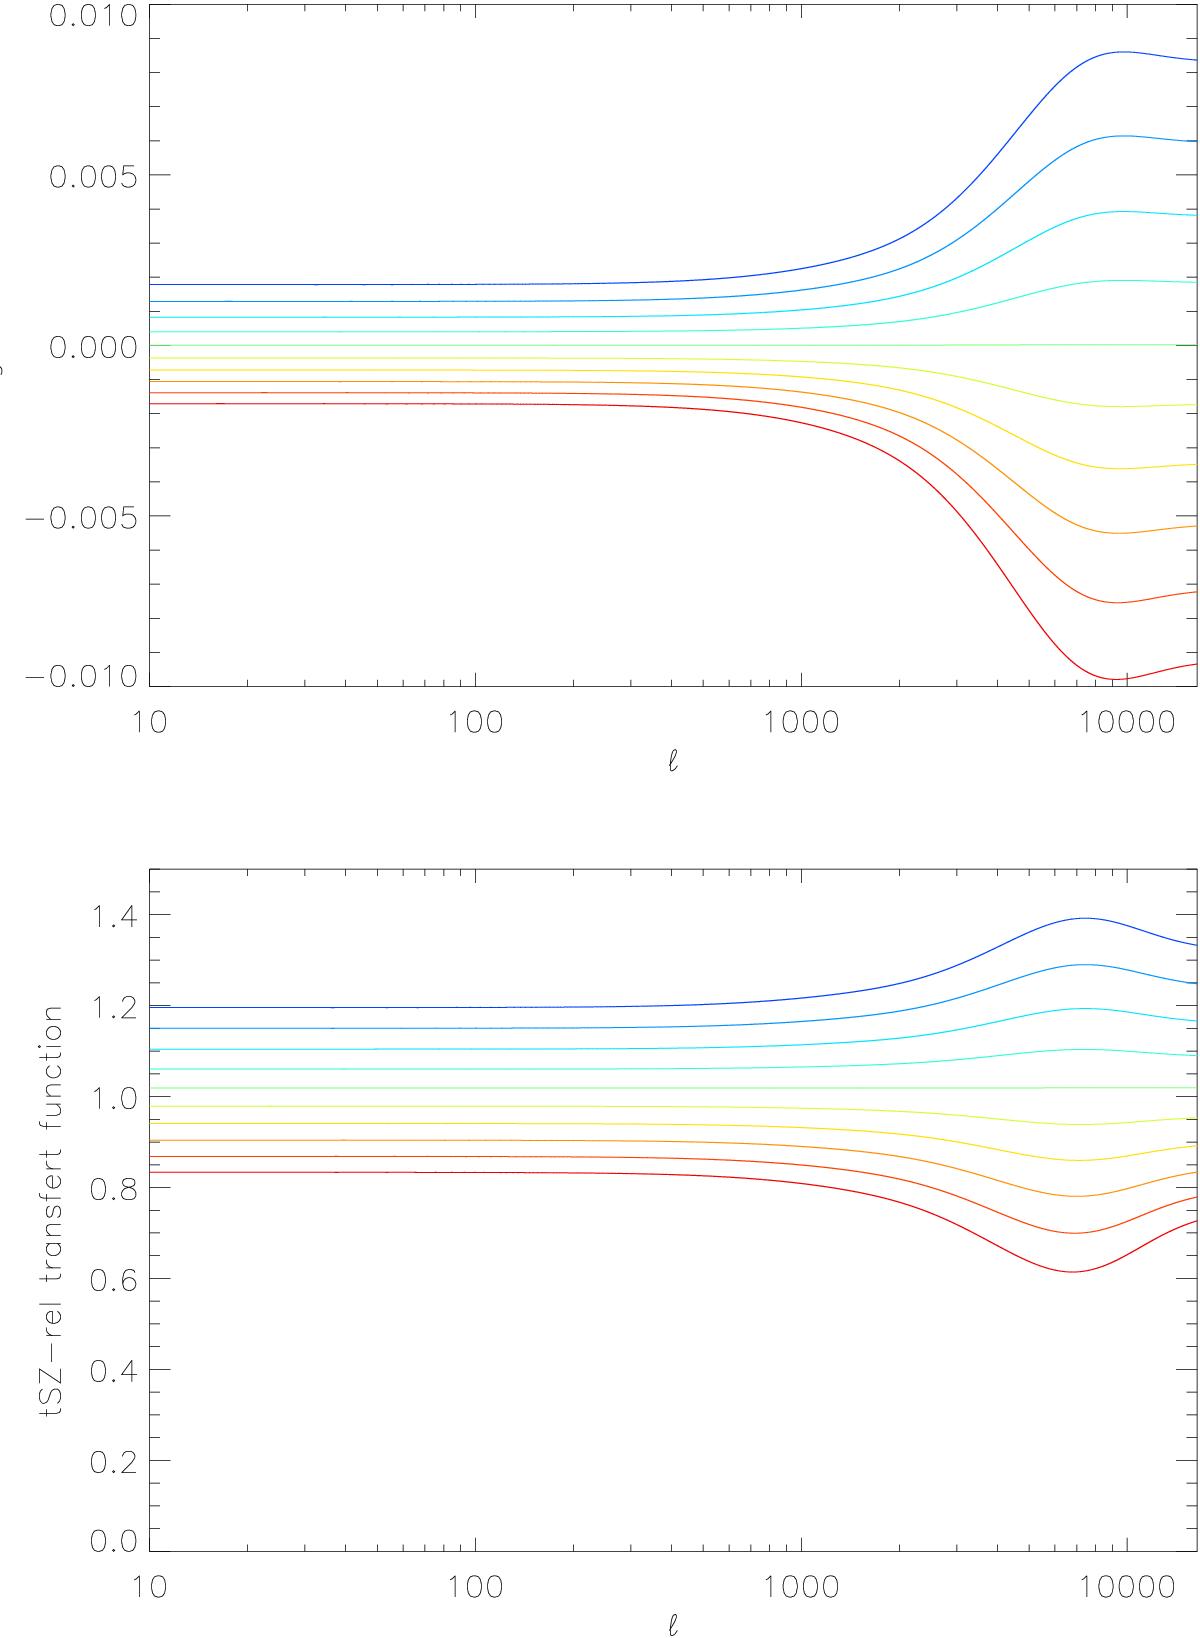
Top panel: scale-dependant tSZ relativistic correction contamination into the tSZ y-map. Bottom panel: scale-dependant bias on tSZ relativistic correction amplitude due to our first-order linear approximation of the tSZ SED. Color ranging from blue to red indicates the considered temperature from 0 to 10 keV.
Current usage metrics show cumulative count of Article Views (full-text article views including HTML views, PDF and ePub downloads, according to the available data) and Abstracts Views on Vision4Press platform.
Data correspond to usage on the plateform after 2015. The current usage metrics is available 48-96 hours after online publication and is updated daily on week days.
Initial download of the metrics may take a while.