Fig. 10
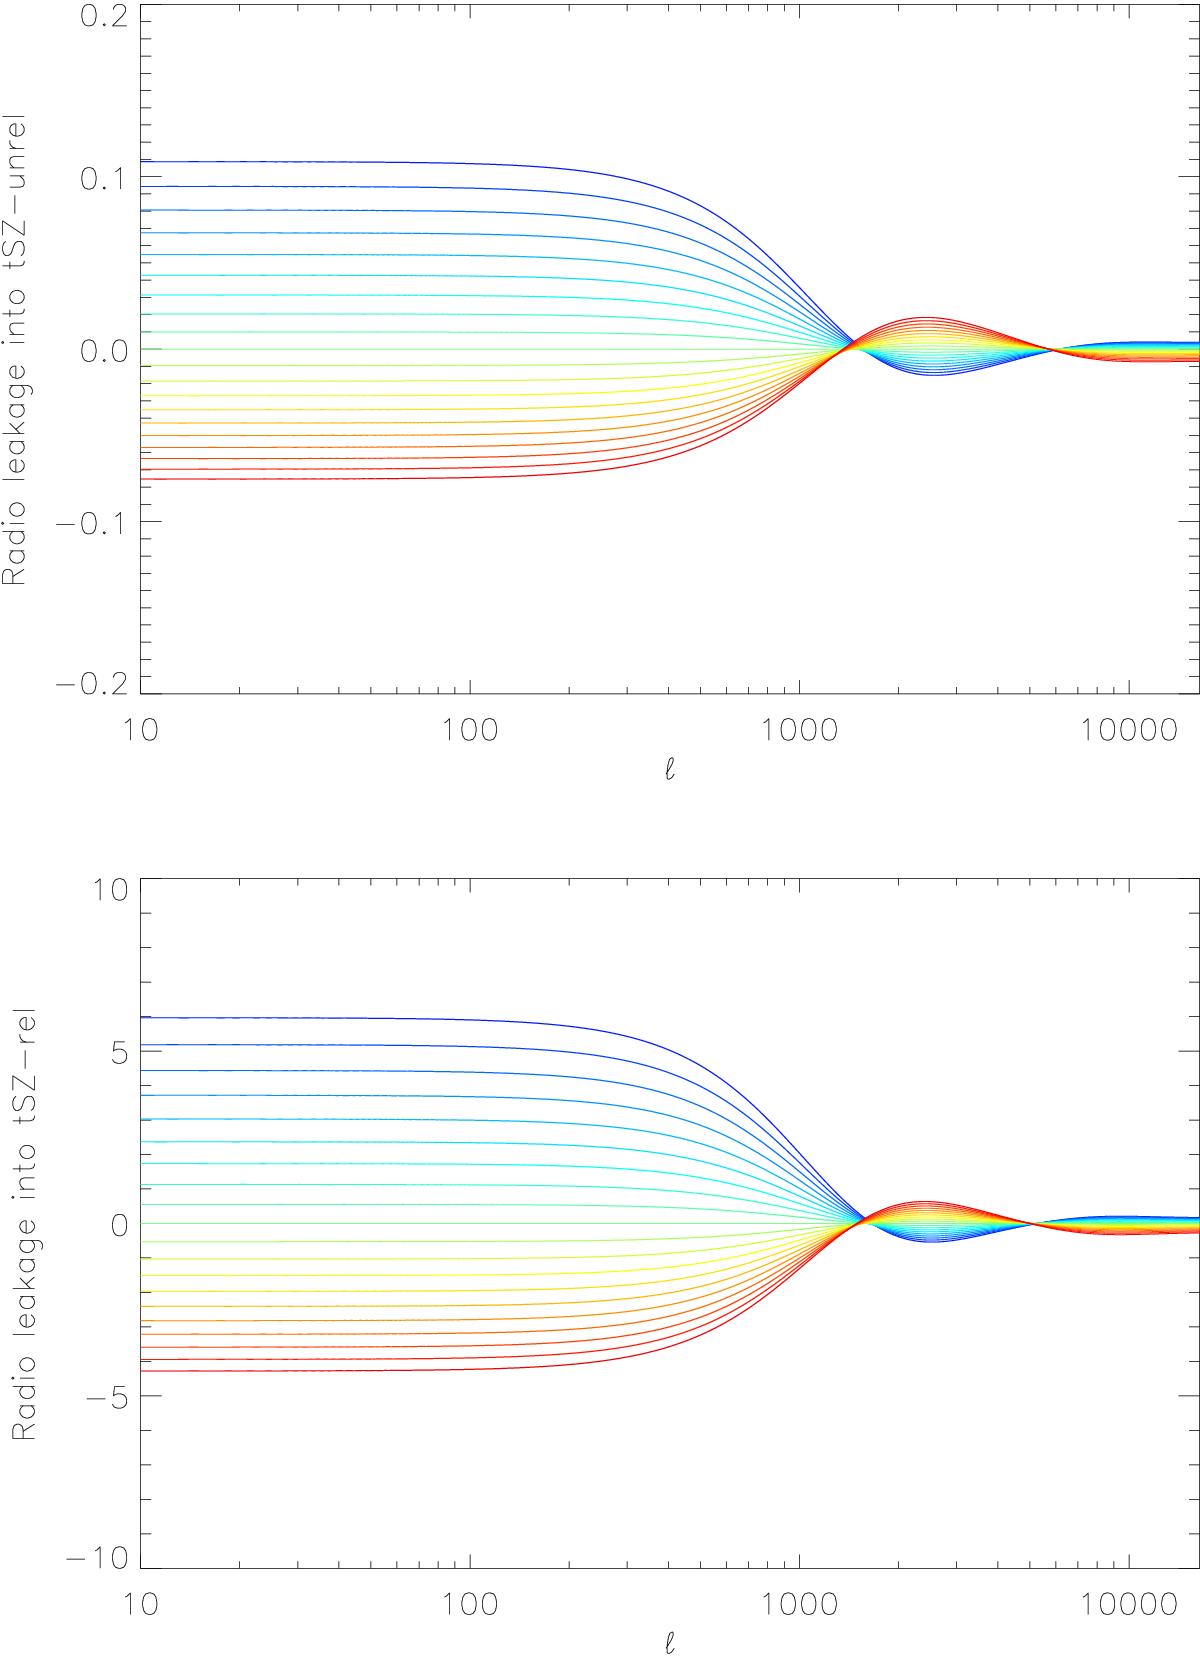
Radio component residuals in the tSZ y-map (top panel) and r-map (bottom panel) as a function of the scale ℓ for a miss-estimation of radio emission spectral properties. Color ranging from blue to red indicates the considered error on the radio source SED spectral index, αr, from –0.2 to 0.2. An intensity of 1 KCMB at 195 GHz is used as a reference for the radio emission.
Current usage metrics show cumulative count of Article Views (full-text article views including HTML views, PDF and ePub downloads, according to the available data) and Abstracts Views on Vision4Press platform.
Data correspond to usage on the plateform after 2015. The current usage metrics is available 48-96 hours after online publication and is updated daily on week days.
Initial download of the metrics may take a while.