Fig. 6
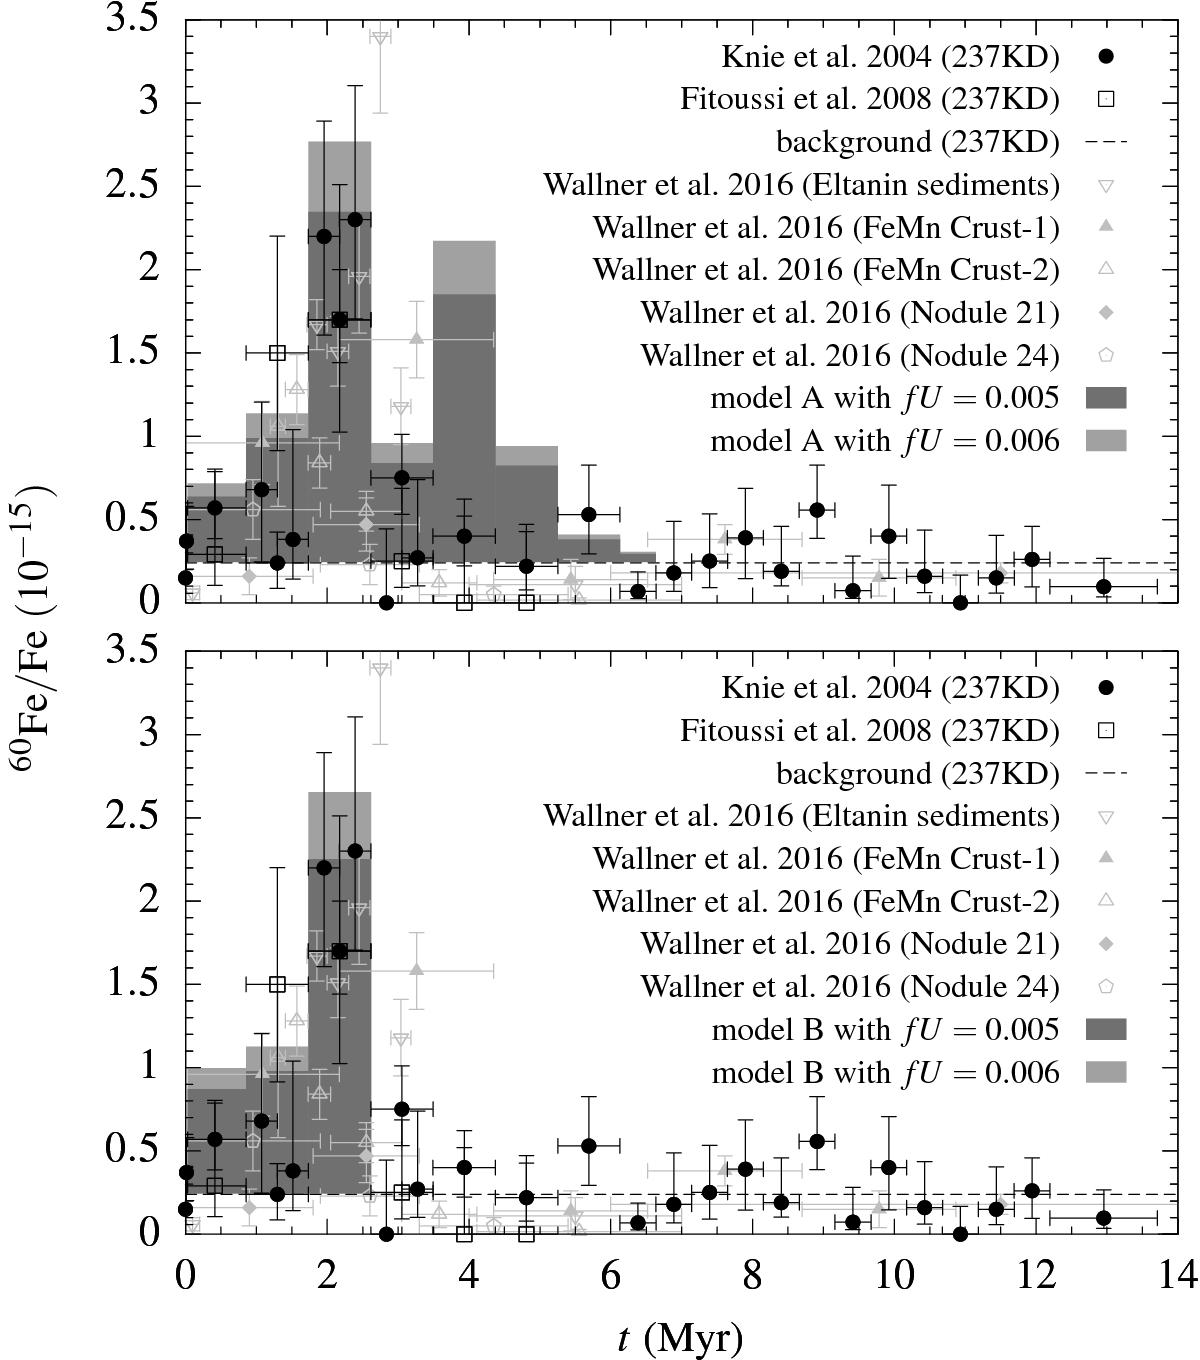
Comparison of the measured (symbols with error bars) and simulated (histograms) 60Fe/Fe ratio as a function of the terrestrial archive’s layer age for model A (upper panel) and B (lower panel). Simulation data is set upon the instrumental background derived specifically for 237KD, which is indicated by the dashed line. The grey levels of the histograms refer to the 60Fe survival fractions employed.
Current usage metrics show cumulative count of Article Views (full-text article views including HTML views, PDF and ePub downloads, according to the available data) and Abstracts Views on Vision4Press platform.
Data correspond to usage on the plateform after 2015. The current usage metrics is available 48-96 hours after online publication and is updated daily on week days.
Initial download of the metrics may take a while.