Fig. 1
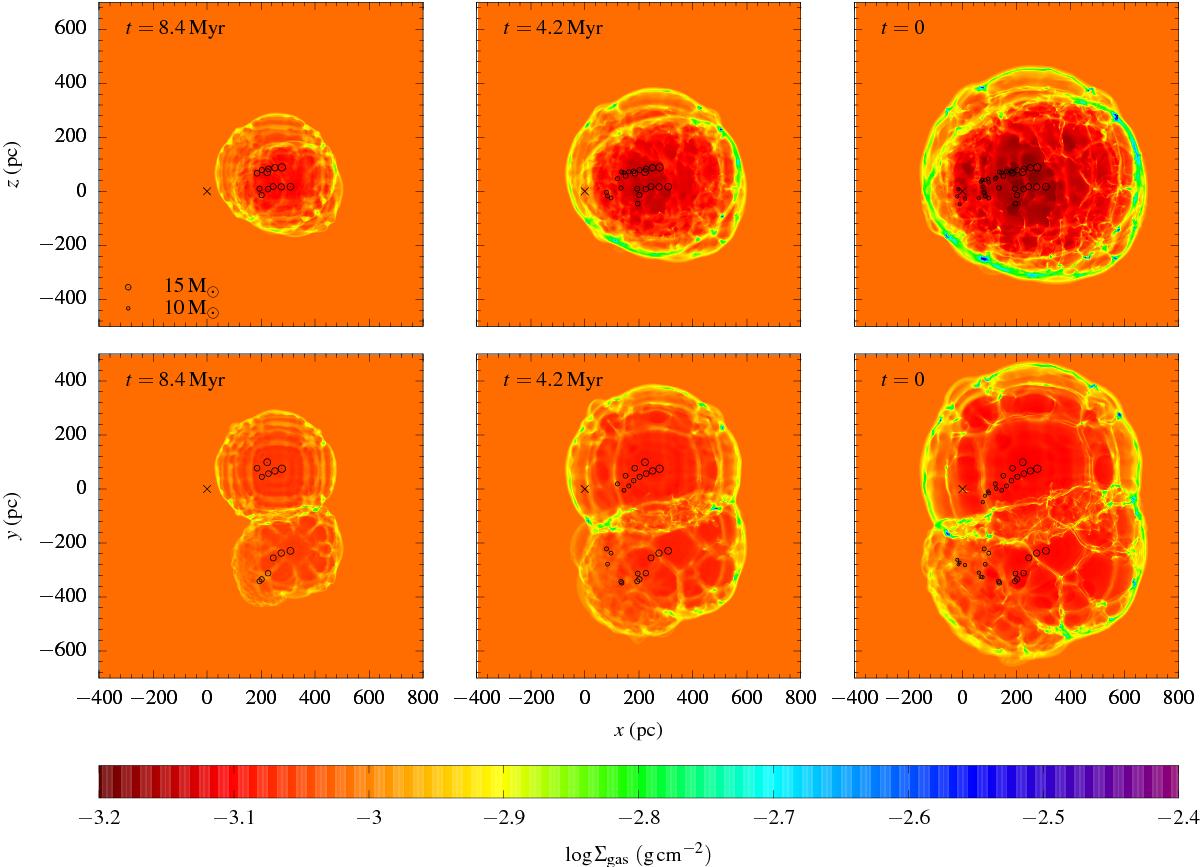
Colour-coded maps of the logarithmic total gas column density in model A for three different times before present. Integrations along the y- and z-axes are shown in the upper and lower panels, respectively. Earth’s projected position is marked by a cross. Circles indicate the projected centres of SN explosions that occurred in the time frame before the snapshot was taken. The sizes of the circles correspond to the initial masses of the progenitor stars (see legend in the upper left panel).
Current usage metrics show cumulative count of Article Views (full-text article views including HTML views, PDF and ePub downloads, according to the available data) and Abstracts Views on Vision4Press platform.
Data correspond to usage on the plateform after 2015. The current usage metrics is available 48-96 hours after online publication and is updated daily on week days.
Initial download of the metrics may take a while.