Fig. 5
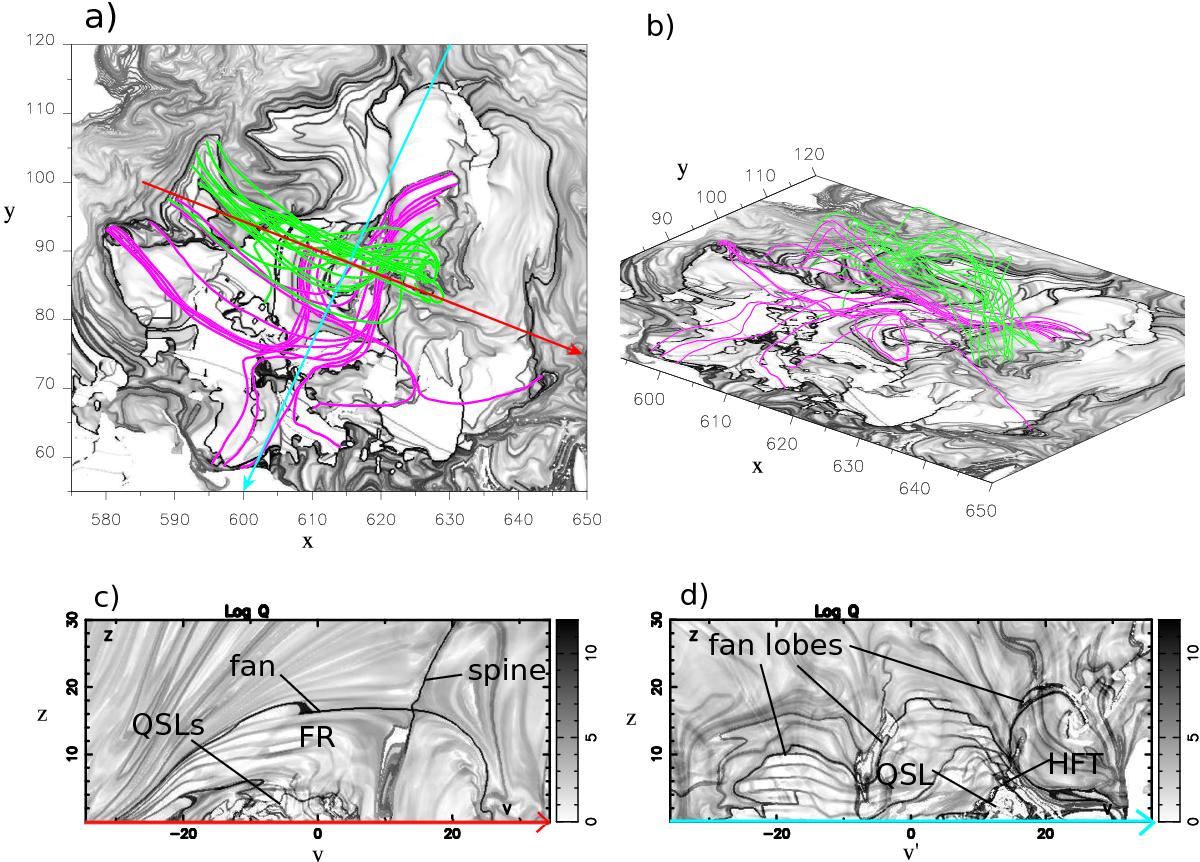
Q-factor distribution in the inner connectivity domain. Panels a and b: top and 3D views of a zoom of the distribution of the Q-factor at z = 0 in the parasitic polarity region enclosed below the fan area, with log Q = 1 in white and log Q = 12 in black. The pink lines show low-lying internal QSLs confined below a green flux rope. Panels c and d: vertical 2D cuts along the red and blue arrows plotted in panel a, respectively, of the Q-factor computed from z = 0 to z = 30 Mm. The Q-factor is grey-shaded with white and black respectively showing log Q = 0 and log Q = 12. The x- and y-axis units are in arcseconds defined by the CEA projection.
Current usage metrics show cumulative count of Article Views (full-text article views including HTML views, PDF and ePub downloads, according to the available data) and Abstracts Views on Vision4Press platform.
Data correspond to usage on the plateform after 2015. The current usage metrics is available 48-96 hours after online publication and is updated daily on week days.
Initial download of the metrics may take a while.