Fig. 10
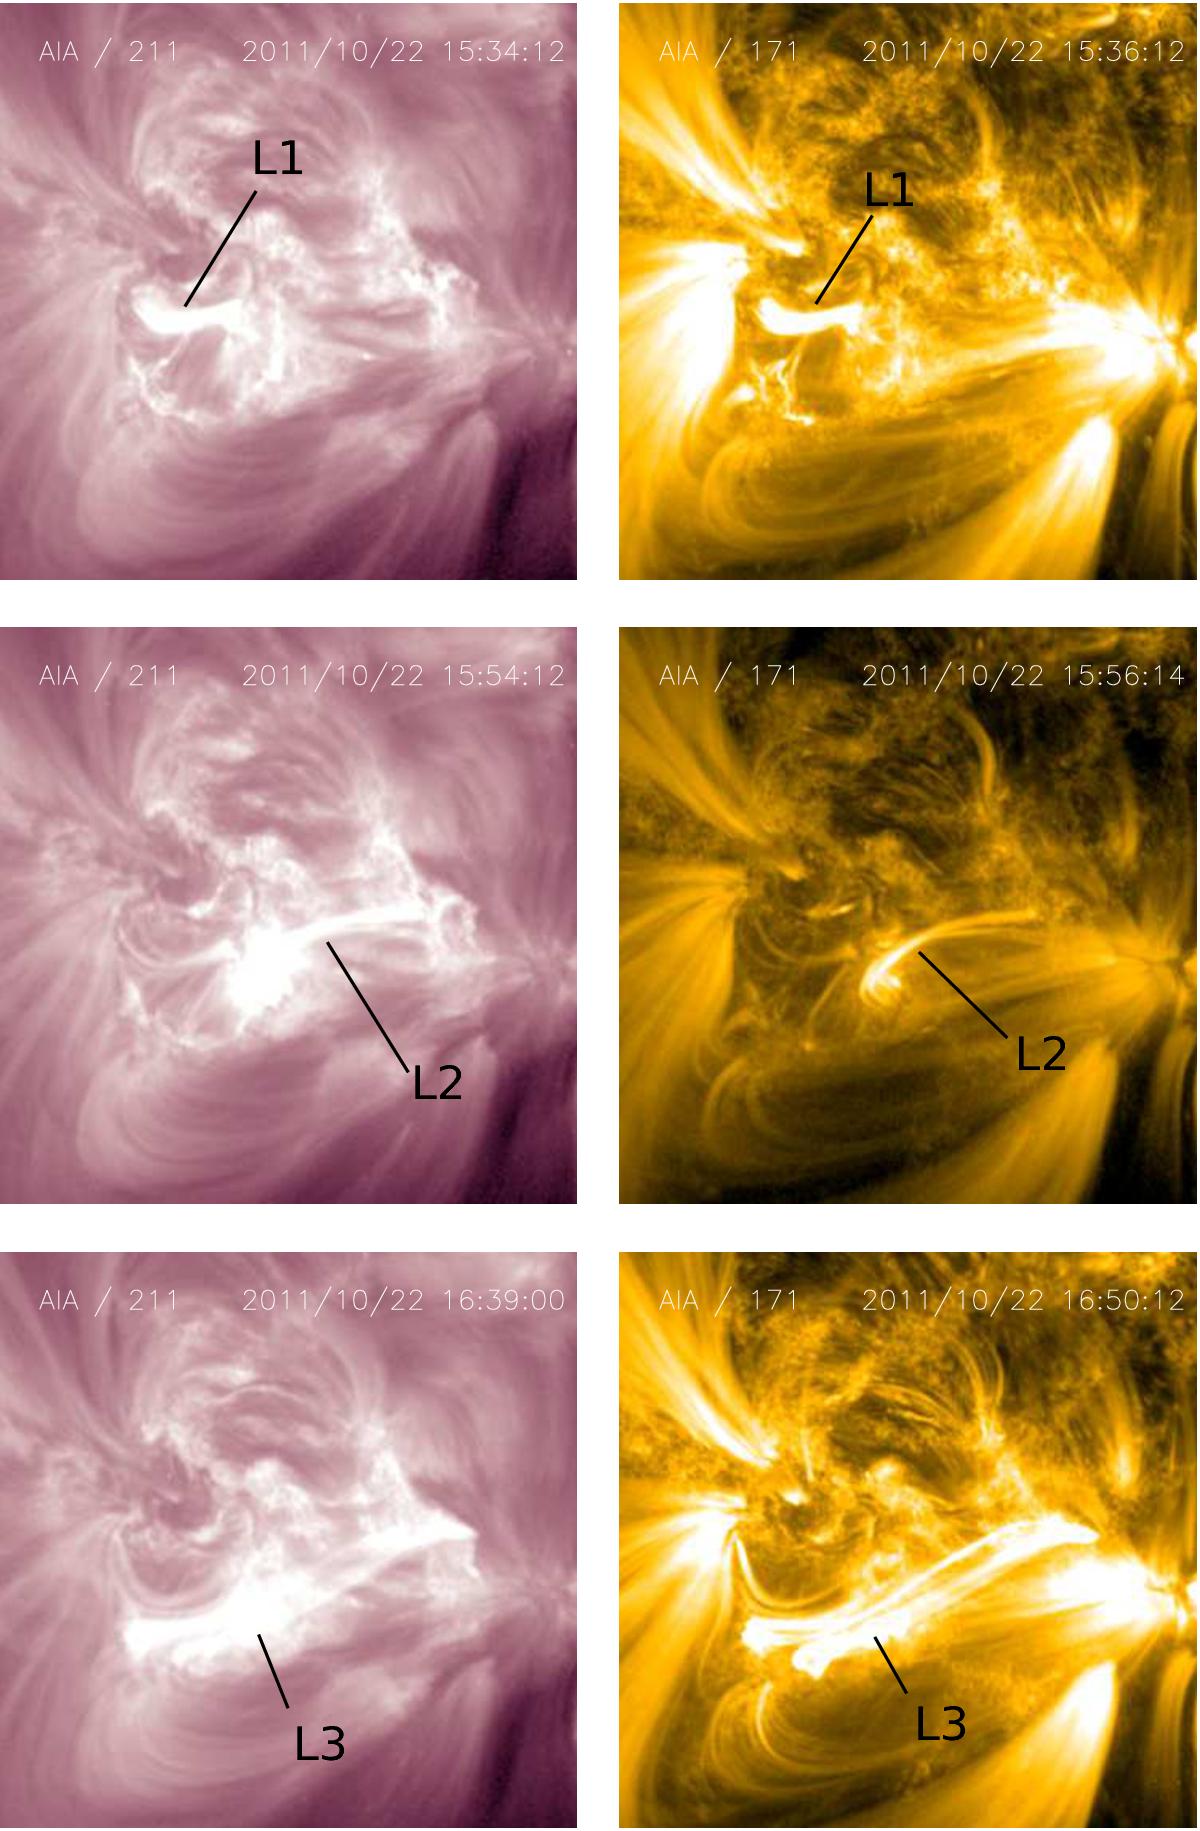
Time sequence of AIA images showing one time for each EUV late episode. From top to bottom, the rows show AIA images at three times around the peaks at 171 Å and 211 Å. Each column corresponds to an AIA channel observing the flare, from top to bottom: 211 Å, and 171Å. The images are in the observer’s view and the field of view is the same as in Fig. 1.
Current usage metrics show cumulative count of Article Views (full-text article views including HTML views, PDF and ePub downloads, according to the available data) and Abstracts Views on Vision4Press platform.
Data correspond to usage on the plateform after 2015. The current usage metrics is available 48-96 hours after online publication and is updated daily on week days.
Initial download of the metrics may take a while.