Fig. 7
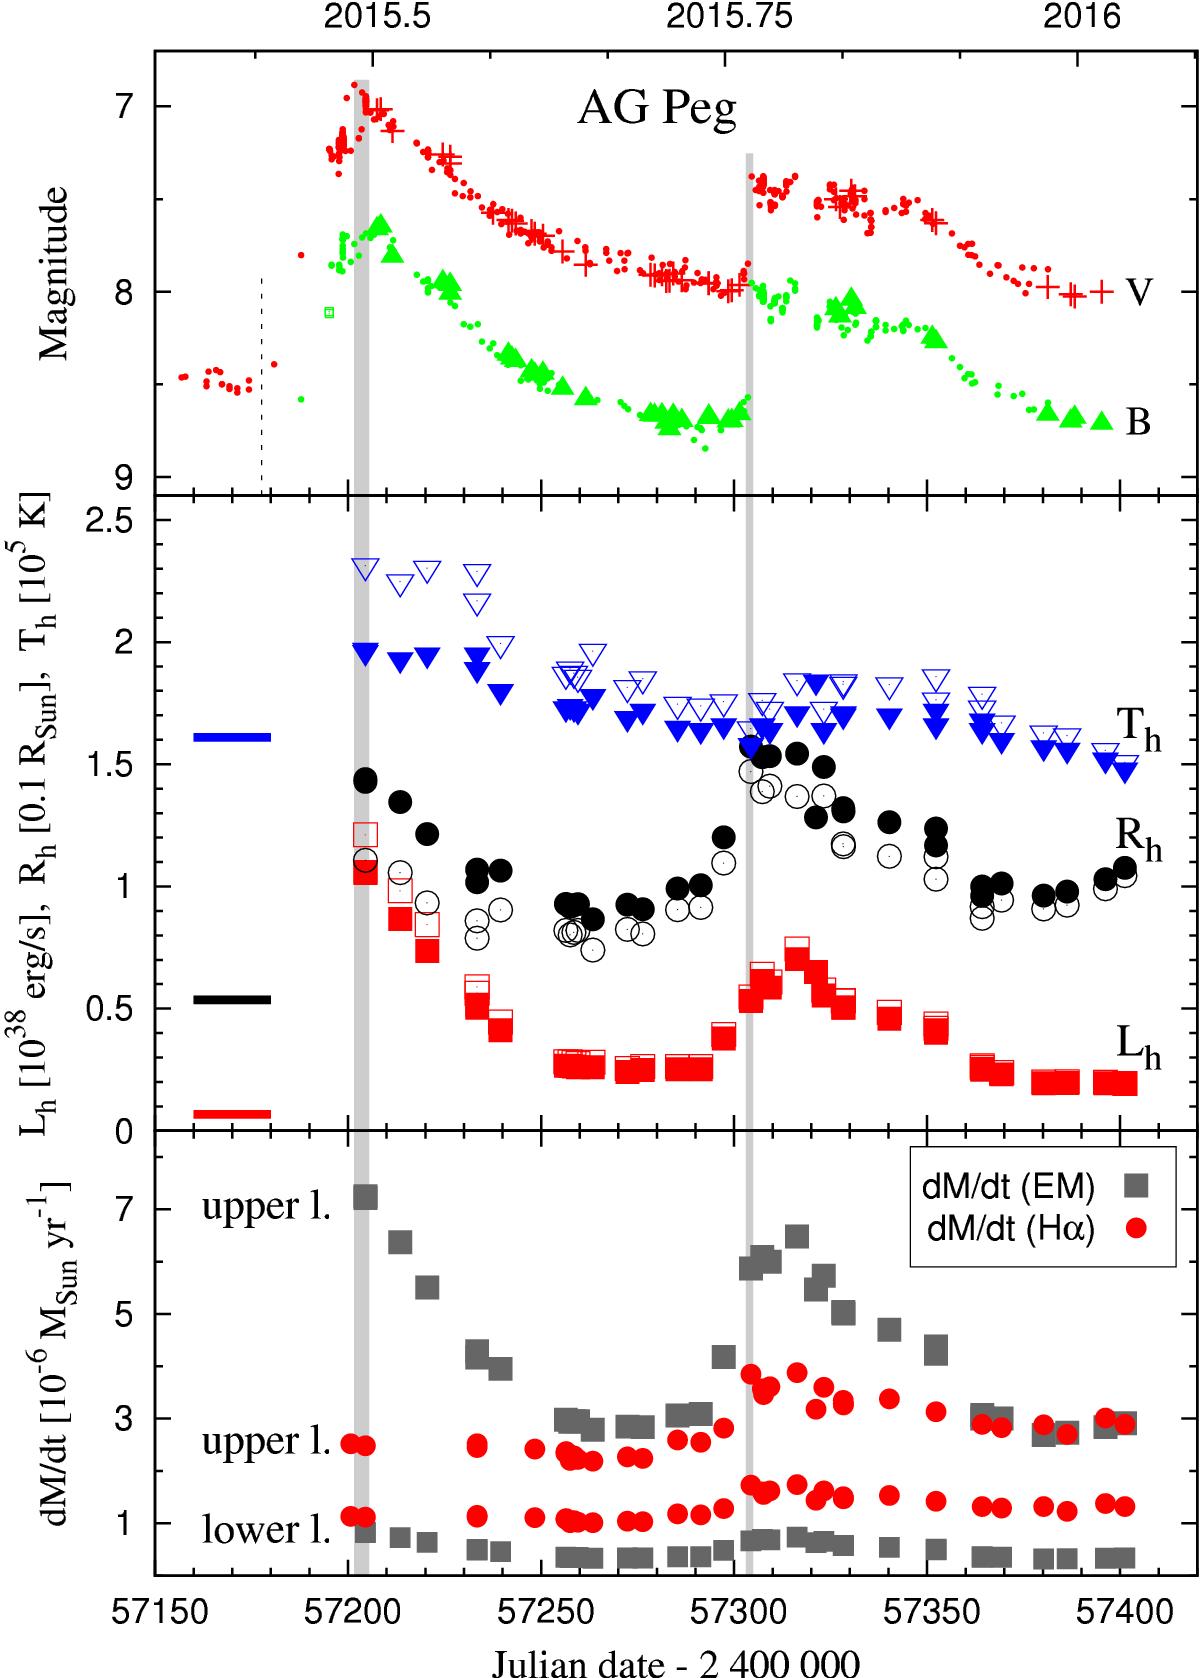
Evolution of the parameters Lh, Rh, Th (middle), and the mass-loss rate Ṁh from the hot component (bottom; the upper and lower limits are denoted by “upper l.” and “lower l.”). The dotted and grey lines mark the beginning of the explosion (June 5.10 ± 3.3) and the maxima in the LC (June 30.0 ± 2.0, Oct. 8.5 ± 0.5). Filled and open symbols correspond to Th from Eqs. (7) and (8). Data are listed in Table 5.
Current usage metrics show cumulative count of Article Views (full-text article views including HTML views, PDF and ePub downloads, according to the available data) and Abstracts Views on Vision4Press platform.
Data correspond to usage on the plateform after 2015. The current usage metrics is available 48-96 hours after online publication and is updated daily on week days.
Initial download of the metrics may take a while.