Free Access
Fig. 6
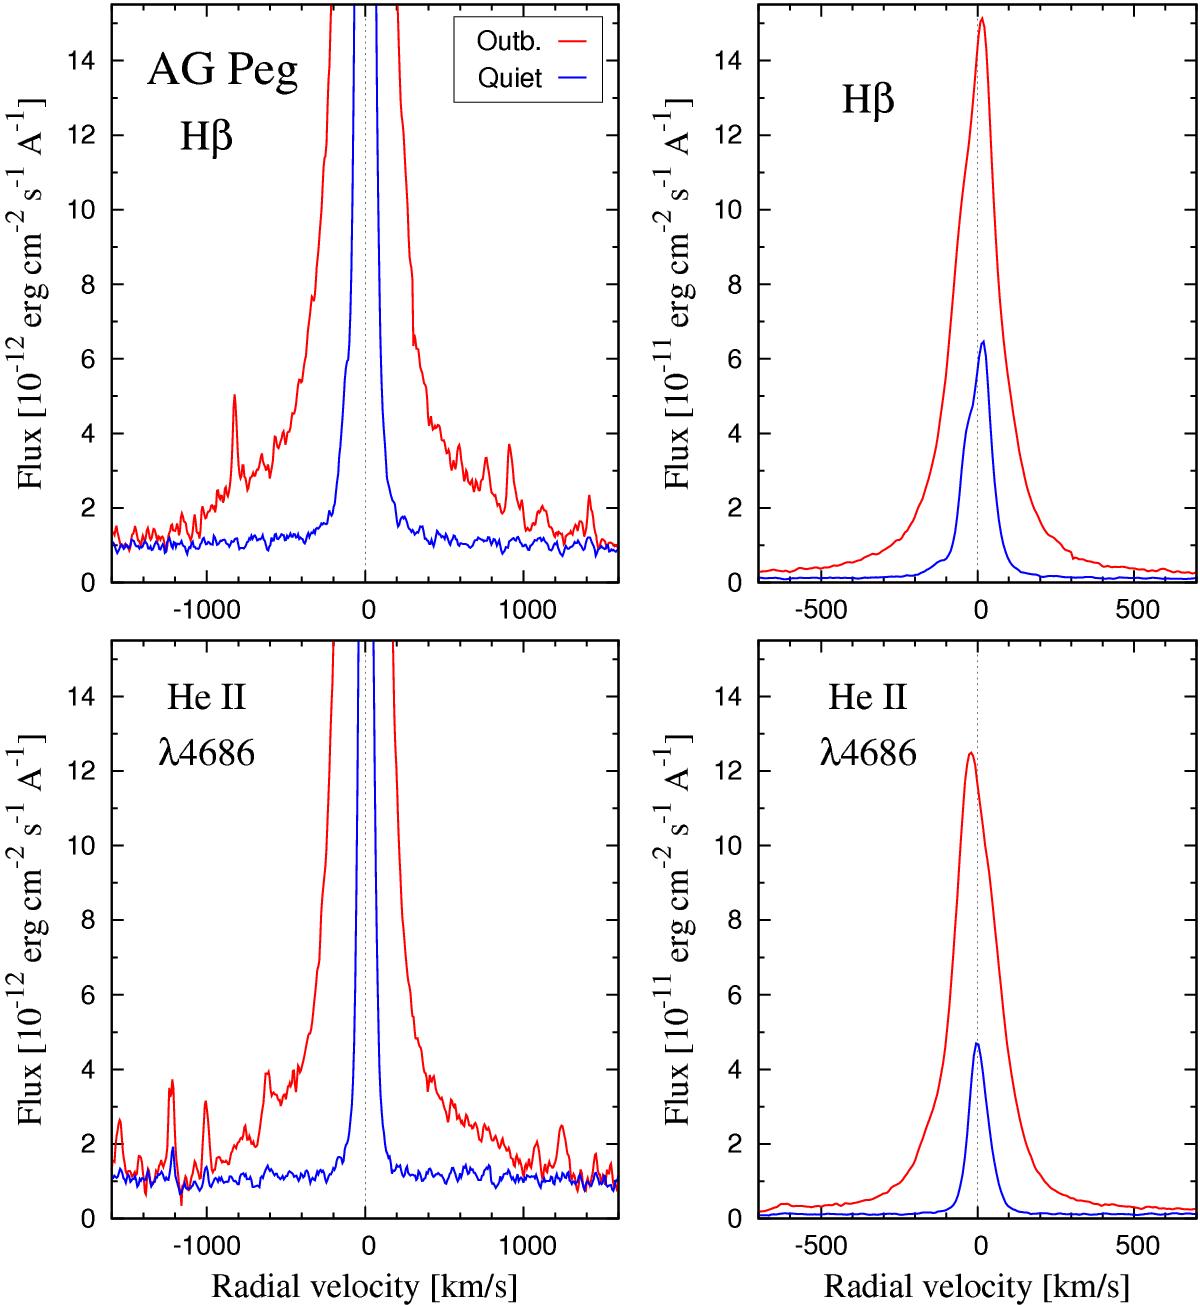
Significant broadening of Hβ and He ii λ4686 line profiles was observed during the outburst (red line, July 9, 2015) with respect to quiescence (blue line, October 26, 2013). Local continuum was subtracted.
Current usage metrics show cumulative count of Article Views (full-text article views including HTML views, PDF and ePub downloads, according to the available data) and Abstracts Views on Vision4Press platform.
Data correspond to usage on the plateform after 2015. The current usage metrics is available 48-96 hours after online publication and is updated daily on week days.
Initial download of the metrics may take a while.