Free Access
Fig. 2
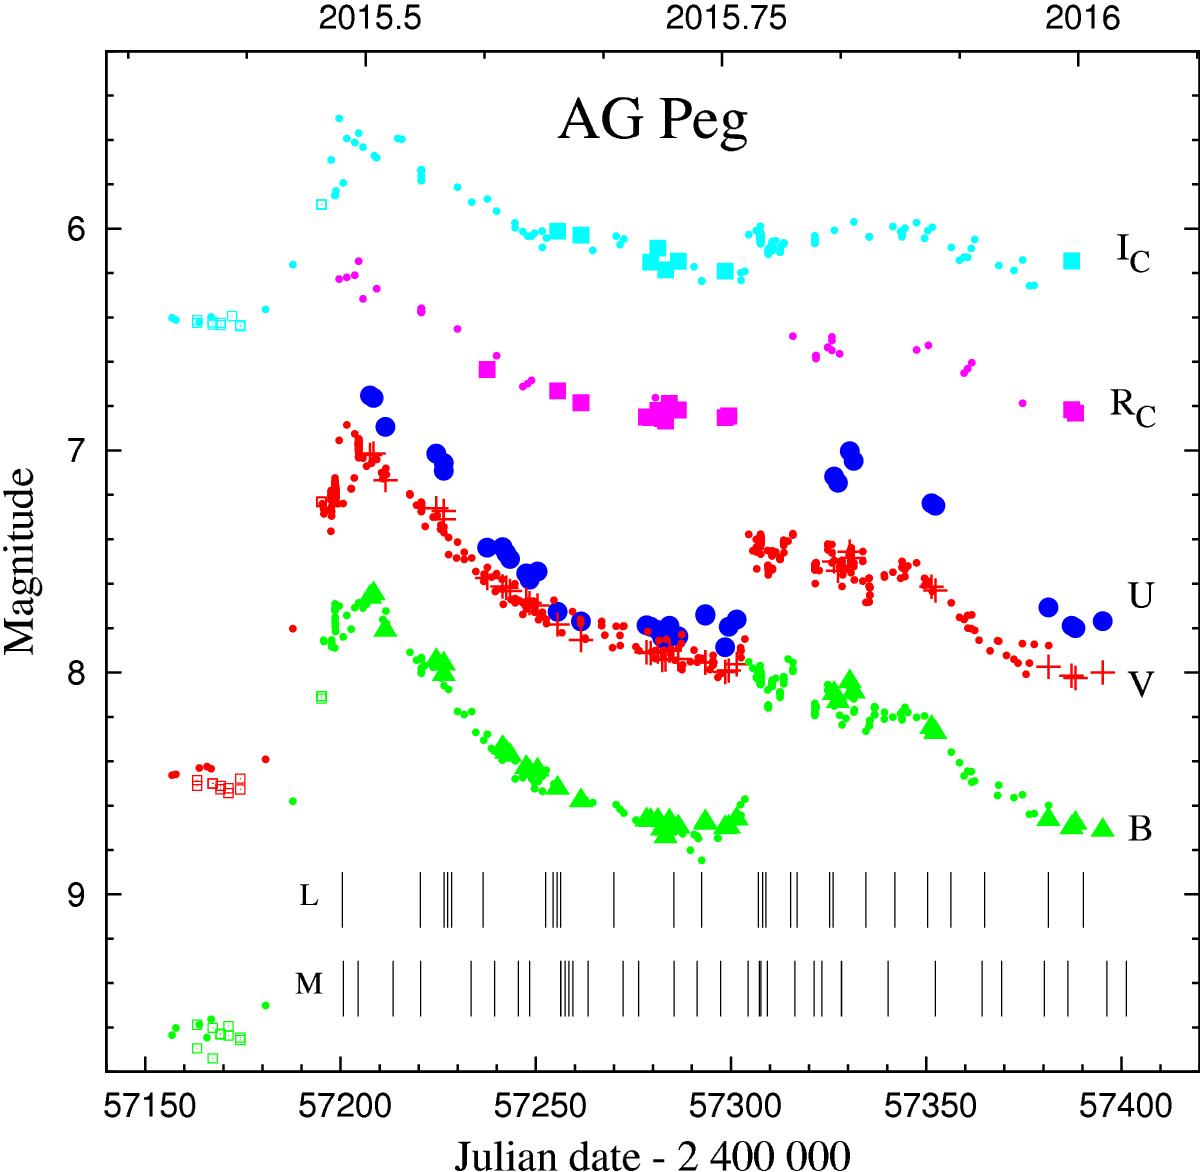
U,B,V,RC,IC LCs of AG Peg during its 2015 outburst. Large symbols are our measurements (Table 1), while small ones are from the AAVSO database and those collected by the VSOLJ observer Hiroyuki Maehara (open squares prior to the brightening). Vertical bars denote the dates of our low (L) and medium (M) resolution spectra.
Current usage metrics show cumulative count of Article Views (full-text article views including HTML views, PDF and ePub downloads, according to the available data) and Abstracts Views on Vision4Press platform.
Data correspond to usage on the plateform after 2015. The current usage metrics is available 48-96 hours after online publication and is updated daily on week days.
Initial download of the metrics may take a while.